. 2014 Oct;42(18):11291-303.
doi: 10.1093/nar/gku777. Epub 2014 Sep 17.

A high-resolution network model for global gene regulation in Mycobacterium tuberculosis

Affiliations

A high-resolution network model for global gene regulation in Mycobacterium tuberculosis

Eliza J R Peterson et al. Nucleic Acids Res. 2014 Oct.

Abstract

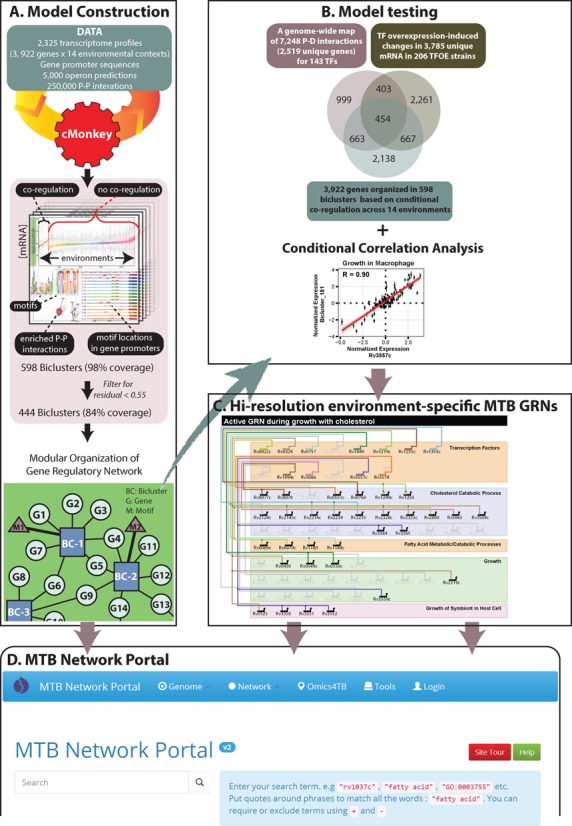
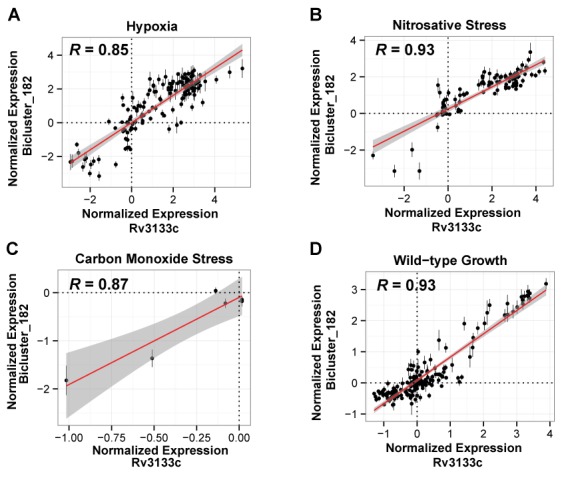
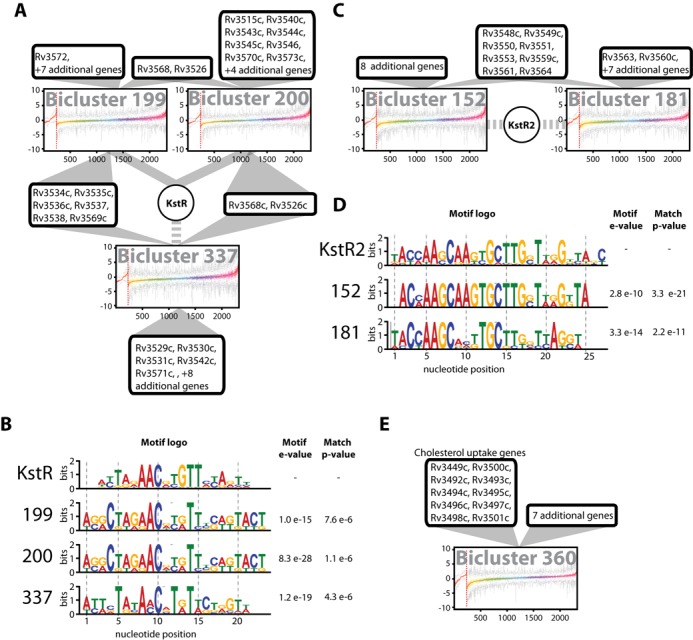
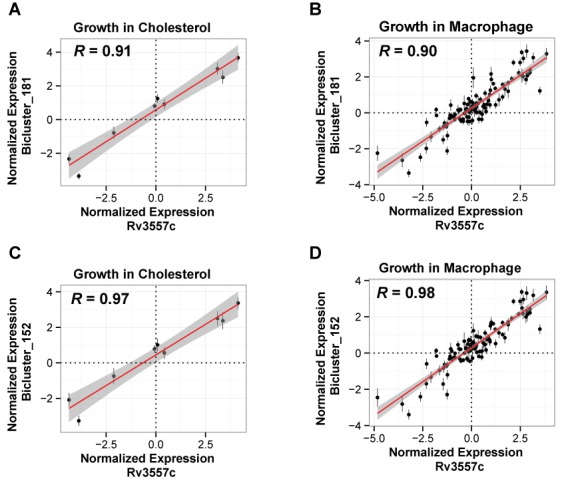
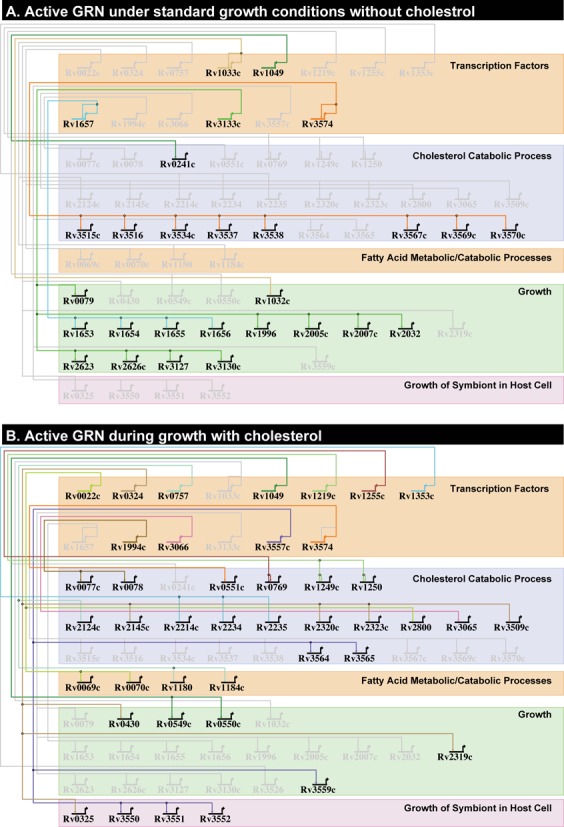
The resilience of Mycobacterium tuberculosis (MTB) is largely due to its ability to effectively counteract and even take advantage of the hostile environments of a host. In order to accelerate the discovery and characterization of these adaptive mechanisms, we have mined a compendium of 2325 publicly available transcriptome profiles of MTB to decipher a predictive, systems-scale gene regulatory network model. The resulting modular organization of 98% of all MTB genes within this regulatory network was rigorously tested using two independently generated datasets: a genome-wide map of 7248 DNA-binding locations for 143 transcription factors (TFs) and global transcriptional consequences of overexpressing 206 TFs. This analysis has discovered specific TFs that mediate conditional co-regulation of genes within 240 modules across 14 distinct environmental contexts. In addition to recapitulating previously characterized regulons, we discovered 454 novel mechanisms for gene regulation during stress, cholesterol utilization and dormancy. Significantly, 183 of these mechanisms act uniquely under conditions experienced during the infection cycle to regulate diverse functions including 23 genes that are essential to host-pathogen interactions. These and other insights underscore the power of a rational, model-driven approach to unearth novel MTB biology that operates under some but not all phases of infection.


Figures

Figure 1.
Figure 1.
An overview of the approach to model global gene regulation in Mycobacterium tuberculosis. The approach consists of four parts. (A) The model was constructed using publicly available data. The cMonkey biclustering algorithm identified sets of genes that are co-regulated under a subset of experimental conditions, have a common motif in their promoters and are enriched in protein–protein (P–P) interactions. Biclusters were filtered based on their residuals and the resulting biclusters were organized into a network model of gene regulation. (B) The model was tested for accuracy by investigating how often two or more genes within a bicluster were bound by the same TF (P–D interactions) and had mRNA changes upon over-expression of that TF. This identified a set of 454 genes that were co-regulated in varying combinations across biclusters. (C) Validated biclusters were investigated for environment-specific regulation patterns of important functions in MTB. (D) The MTB Network Portal was developed to allow exploration of the model and enable predictions for experimental investigation. The web-portal is located at http://networks.systemsbiology.net/mtb/.
Figure 2.
Figure 2.
The conditional regulation of bicluster_182 by DosR. The scatter plots show the correlation of expression for DosR versus the median correlation of gene members of bicluster_182 under (A) hypoxia (R = 0.85, P-value = 0.004), (B) nitric oxide (R = 0.87, P-value < 2 × 10⁻¹⁶), (C) carbon monoxide stress (R = 0.87, P-value = 0.0001) and (D) wild-type growth conditions (R = 0.93 and P-value < 2 × 10⁻¹⁶). Error bars show the standard deviation of bicluster gene expression. The number of data points in each plot equals the number of transcriptome profiles in the environmental context shown in the plot.
Figure 3.
Figure 3.
The regulatory interaction subnetwork of cholesterol utilization. The figure shows a subset of biclusters enriched for genes essential for growth on cholesterol (see text). (A) KstR is a gene member of bicluster 199 and bicluster 200, as shown by solid lines. Bicluster 337 was associated with KstR through motif analysis (see text), which is represented by dashed lines. Genes involved in cholesterol utilization are listed and connected by solid lines to their regulatory biclusters. (B) The motif logos detected for KstR and biclusters from panel (A). The e-values of the motifs and P-values from alignment with KstR are shown. (C) Biclusters involved in cholesterol utilization and associated with KstR2 by motif analysis. (D) The motif logos detected for KstR2 and biclusters from panel (C). The e-values of the motifs and P-values from alignment with KstR2 are shown. (E) Bicluster 360 contains 10 genes that are involved in cholesterol uptake.
Figure 4.
Figure 4.
The conditional regulation of KstR2 biclusters. The scatter plots show the correlation of expression for KstR2 versus the median correlation of gene members of bicluster_181 under (A) growth on cholesterol (R = 0.98, P-value = 5.6 × 10⁻⁶) and (B) growth in macrophage (R = 0.90, P-value < 2 × 10⁻¹⁶) and KstR2 versus gene members of bicluster_0152 under (C) growth on cholesterol (R = 0.97, P-value = 9.0 × 10⁻⁶) and (D) growth in macrophage (R = 0.91 and P-value < 2 × 10⁻¹⁶). Error bars show the standard deviation of bicluster gene expression. The number of data points in each plot equals the number of transcriptome profiles in the environmental context shown in the plot.
Figure 5.
Figure 5.
Enivronment-specific gene regulatory networks for Mycobacterium tuberculosis. This figure shows a subset of the gene regulatory network of MTB under (A) wild-type growth conditions and (B) growth in cholesterol, derived from BioTapestry visualization. Transcription Factors (TFs) are grouped together and represented by bent arrows, which extend to horizontal and vertical lines that connect to their regulatory gene targets. The gene targets that are shown were predicted by the EGRIN model to be co-regulated in biclusters and were validated for regulation by their linking TF through ChIP-Seq binding and differential expression from TF overexpression experiments (see text). Inclusion in these models required significant correlation of expression of TF and validated bicluster genes under wild-type growth (A) or growth in cholesterol (B). The arrows and barred lines indicate the direction of correlation (activation or repression). Only gene targets with annotated function that fall into the categories of ‘cholesterol processes’ (metabolic/catabolic), ‘fatty acid processes’ (metabolic/catabolic), ‘growth’ or ‘growth of symbiont in host cell’ are found in the regulatory networks shown here. An interactive version of the BioTapestry network model, with additional environmental contexts, can be found at the MTB Network Portal, located at http://networks.systemsbiology.net/mtb/.

References

    1. Russell D.G., VanderVen B.C., Lee W., Abramovitch R.B., Kim M.J., Homolka S., Niemann S., Rohde K.H. Mycobacterium tuberculosis wears what it eats. Cell Host Microbe. 2010;8:68–76. - PMC - PubMed
    1. Galagan J.E., Minch K., Peterson M., Lyubetskaya A., Azizi E., Sweet L., Gomes A., Rustad T., Dolganov G., Glotova I., et al. The Mycobacterium tuberculosis regulatory network and hypoxia. Nature. 2013;499:178–183. - PMC - PubMed
    1. Balazsi G., Heath A.P., Shi L., Gennaro M.L. The temporal response of the Mycobacterium tuberculosis gene regulatory network during growth arrest. Mol. Syst. Biol. 2008;4:e225. - PMC - PubMed
    1. Rohde K.H., Veiga D.F., Caldwell S., Balazsi G., Russell D.G. Linking the transcriptional profiles and the physiological states of Mycobacterium tuberculosis during an extended intracellular infection. PLoS Pathog. 2012;8:e1002769. - PMC - PubMed
    1. Bonneau R., Facciotti M.T., Reiss D.J., Schmid A.K., Pan M., Kaur A., Thorsson V., Shannon P., Johnson M.H., Bare J.C., et al. A predictive model for transcriptional control of physiology in a free living cell. Cell. 2007;131:1354–1365. - PubMed

Publication types

MeSH terms