. 2014 Sep 17;34(38):12646-61.
doi: 10.1523/JNEUROSCI.1872-14.2014.

Emergent exploration via novelty management

Affiliations

Emergent exploration via novelty management

Goren Gordon et al. J Neurosci. .

Abstract

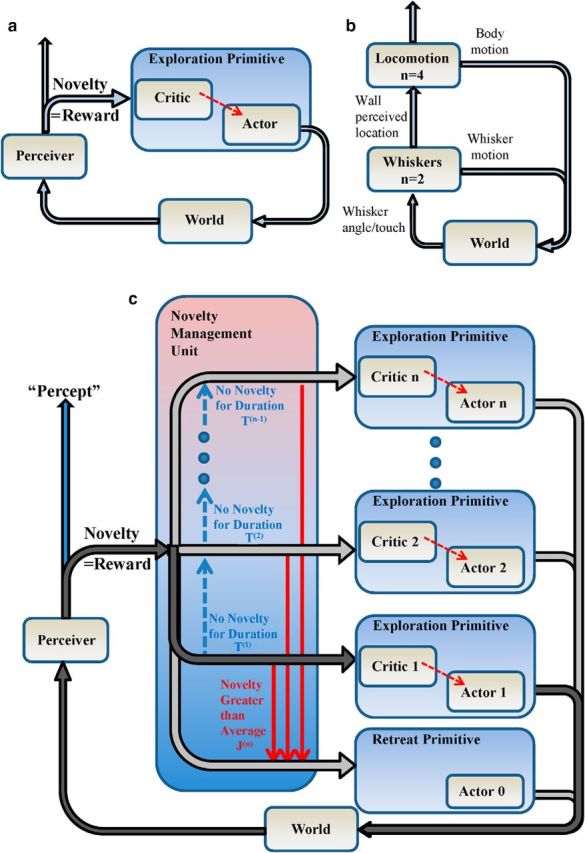
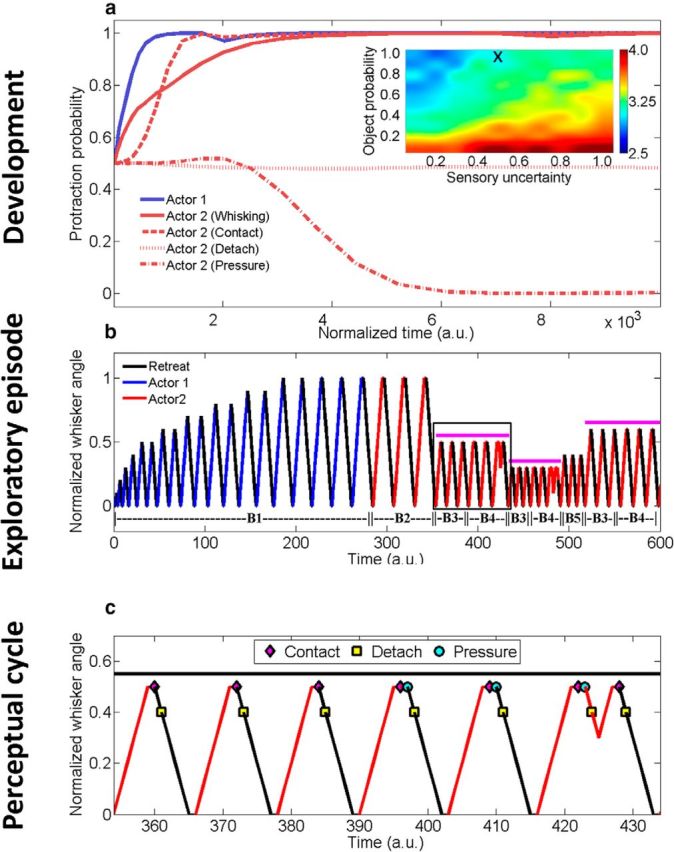
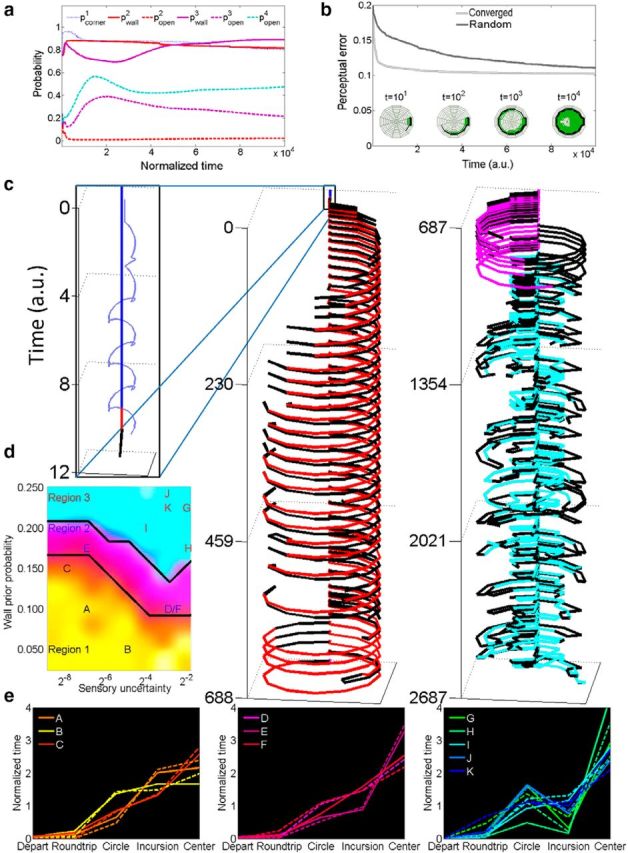
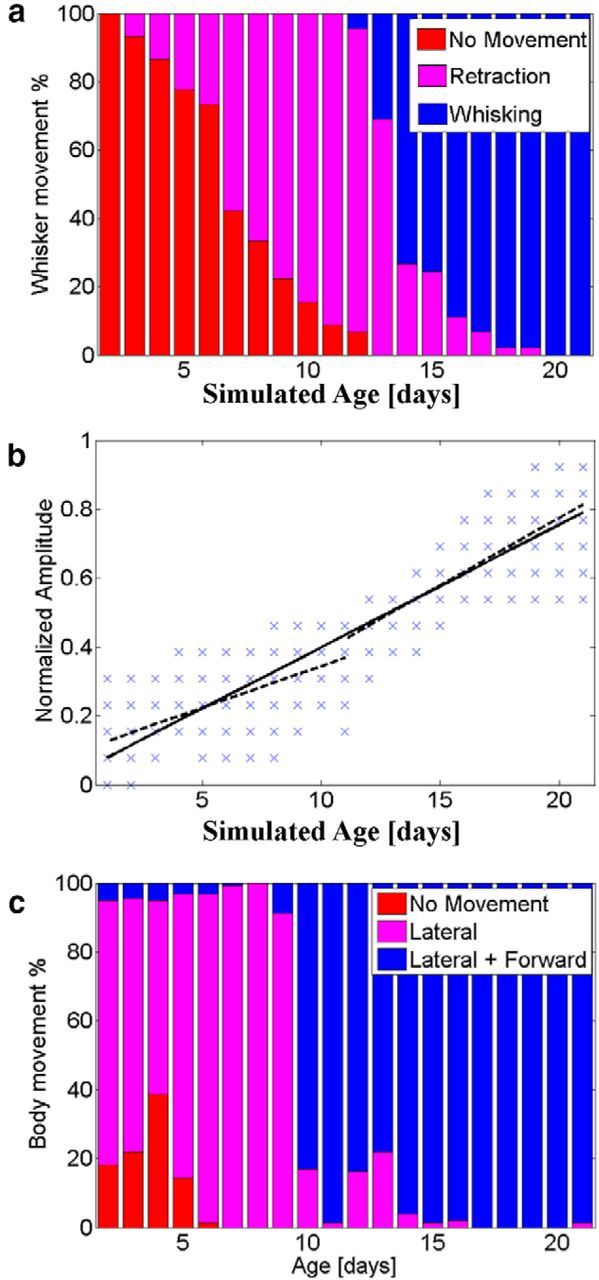
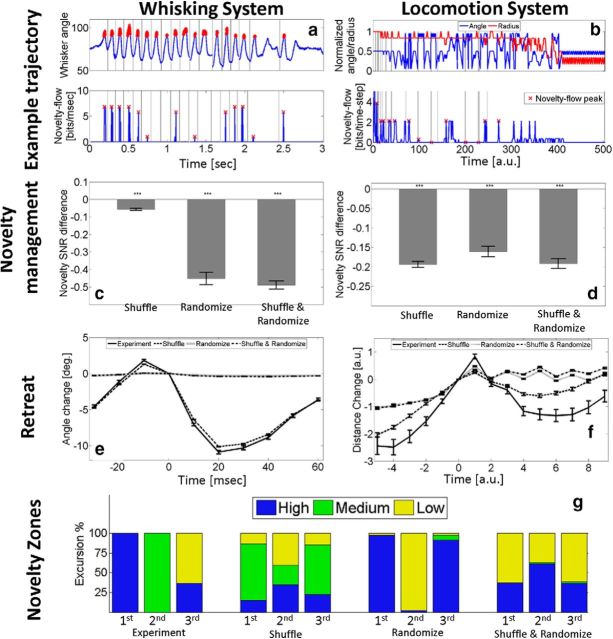
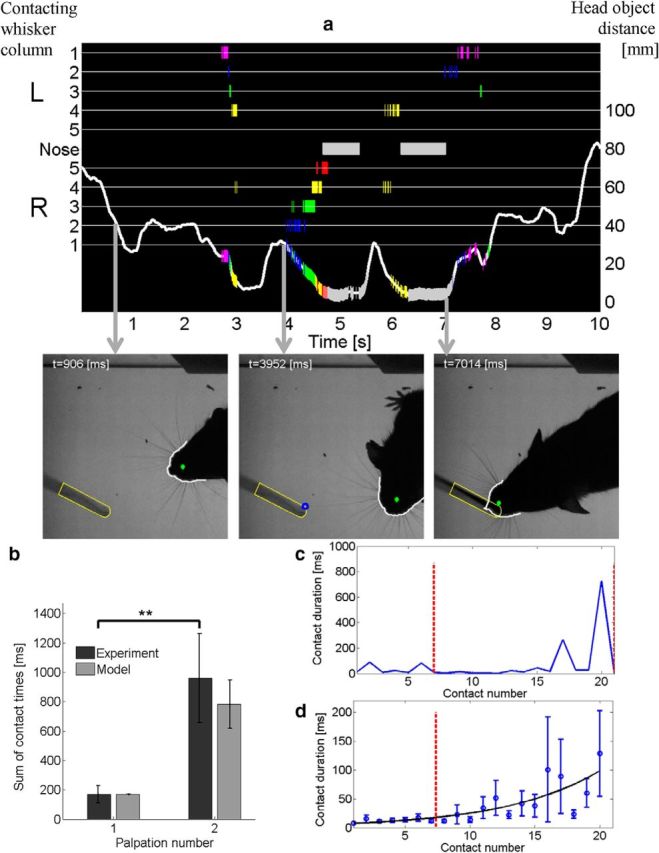
When encountering novel environments, animals perform complex yet structured exploratory behaviors. Despite their typical structuring, the principles underlying exploratory patterns are still not sufficiently understood. Here we analyzed exploratory behavioral data from two modalities: whisking and locomotion in rats and mice. We found that these rodents maximized novelty signal-to-noise ratio during each exploration episode, where novelty is defined as the accumulated information gain. We further found that these rodents maximized novelty during outbound exploration, used novelty-triggered withdrawal-like retreat behavior, and explored the environment in a novelty-descending sequence. We applied a hierarchical curiosity model, which incorporates these principles, to both modalities. We show that the model captures the major components of exploratory behavior in multiple timescales: single excursions, exploratory episodes, and developmental timeline. The model predicted that novelty is managed across exploratory modalities. Using a novel experimental setup in which mice encountered a novel object for the first time in their life, we tested and validated this prediction. Further predictions, related to the development of brain circuitry, are described. This study demonstrates that rodents select exploratory actions according to a novelty management framework and suggests a plausible mechanism by which mammalian exploration primitives can be learned during development and integrated in adult exploration of complex environments.

Keywords: active sensing; hierarchical model; intrinsic motivation; reinforcement learning; whisker system.


Figures

Figure 1.
Figure 1.
A schematic diagram of the model (adapted from Gordon et al., 2014) extending to arena exploration and across both sensory systems. a, Basic curiosity loop. The agent actively perceives the world through its sensors and learns to predict the next state of its sensors from the current state and the action performed by the actor. Novelty, measured as information gain, is the intrinsic reward for an AC module that implements temporal difference error (dashed red arrow) reinforcement learning. b, A model of an exploring rodent that moves its whiskers to perceive walls and moves its body to perceive an arena. The whiskers modality is composed of two loops, whereas the locomotion modality is composed of four loops. c, A hierarchical model of an active perceptual modality that contains n AC modules and one retreat primitive. At any time, only a single loop is closed (dark arrows); if at any time novelty is higher than the average of the active module, J(n), the retreat primitive is activated (red arrows); if novelty is lower than the average for the duration of the active loop, T(n), the next loop is activated (blue arrows).
Figure 2.
Figure 2.
Model implementation on the whisker system across different timescales. a, Adapted from Gordon et al. (2014, their Fig. 5). Developmental convergence dynamics of actors, presented as protraction probability as a function of normalized time (αt, where α is the learning rate), averaged over 10 runs for σ = 0.5, pobj = 1.0. The protraction probability of the first actor (blue line) does not depend on contact information; the protraction probabilities of the second actor depend on whisking (solid red line), contact (dashed red line), detach (dotted red line), or pressure (dotted dashed red line) inputs. a, Inset, Logarithm (base 10) of normalized convergence time of the second AC module, as a function of σ and pobj. x marks parameters for a–c. b, Adapted from Gordon et al. (2014, their Fig. 7). Exploratory episode behavior of the entire converged model; whisker angle is depicted as a function of time, where color denotes the active actor. Magenta horizontal lines denote the angular position of an object. B1, actor 1 protracts the whisker and the retreat primitive retracts the whisker whenever a new angle is reached. B2, initially there are no objects in the whisker field and it protracts, whereupon experiencing no novelty, the NMU switches to the retreat policy (retraction). When objects are present, the initial contact is novel and immediately followed by retreat (B3), whereas the following contacts slowly exhibit the full dynamics of the converged actor 2 (B4). B5, when an object is removed from the whisker field, retreat follows high novelty due to false prediction of its location. c, Perceptual cycle of object location (b, enlarged box): protraction upon contact (magenta diamond), retraction upon pressure (cyan circle), and either retraction (t = 426) or protraction (data not shown) upon detach (yellow square) mechanoreceptor activation.
Figure 3.
Figure 3.
Model implementation on locomotive exploration of a novel circular arena (Fonio et al., 2009). a, Convergence dynamics of actors of the four loops (pl = 1,2,3,4), where pcorner denotes the probability to stay in corners, pwall denotes the probability to follow walls, and popen denotes the probability to avoid walls and seek open space (σ = 0.125, P0 = 0.1, averaged over 9 runs). b, Perceiver dynamics when exploring with the converged primitives and novelty management. Mean perceiver error as a function of time for the converged and random actors (same parameters as in a). Insets, Perceiver state at different times, where black denotes the probability of walls, green denotes the probability of no wall, and thickness denotes the distance from probability = 0.5. c, Exploration behavior of a novel circular arena for the converged exploration primitives and novelty management, where color denotes the active primitive (black, retreat; blue, loop 1; red, loop 2; magenta, loop 3; cyan, loop 4) and time progresses from top to bottom. Left, Zoom in on the first steps, where the light blue line denotes orientation of the mouse. Middle, Initial exploration in which only loops 1 and 2 are active. Right, Exploration of open space with loops 3 and 4 until reaching the center of the arena. d, Phase plane of model parameters, where regions were automatically discovered via clustering of the actor probabilities. Distances from cluster centroids are plotted as a function of the two free parameters of the model: σ and P0, where red/green/blue channels denote distance from centroids of clusters 1, 2, and 3. Capital letters (A–K) denote the entire set of mice (n = 11) described in Fonio et al. (2009), positioned in the phase plane such that their behavior best correlated with the behavior generated by the model, given the corresponding parameters. e, Transition trajectories of the experimental mice and matching model agents. Durations of exploration in each behavioral phase, normalized by their mean time, are depicted by their occurrence sequence. Dashed curves represent the behavior of individual mice (Fonio et al., 2009), and solid curves represent the behavior of model agents whose parameters are marked in d.
Figure 4.
Figure 4.
Developmental parameters produced by the model (σwhisker = 0.5; pobj = 1; σlocomotion = 0.125; P0 = 0.05). Whisker data have 1.6 × 10⁵ time steps, automatically segmented to 941 entries, then grouped to 21 equal-sized bins, corresponding to developmental days. Locomotion data have 1.6 × 10⁶ time steps, automatically segmented to 3375 entries, then grouped to 21 equal-sized bins. a, Appearance of whisker motion patterns (retraction/protraction/whisking), which were calculated only for loop 1 (no objects): no movement, normalized whisker angle <0.25; retraction, retraction from base state; whisking, continued protraction followed by full retraction, with amplitude >0.5 the normalized angle; protraction, otherwise. Protraction was never a result. b, Amplitude of whisker movement, calculated as the maximal normalized angle per entry. Comparison between a single linear fit (solid) and piecewise linear fits (dashed). c, Appearance of locomotion patterns (lateral/forward). Model patterns: No movement, entry duration <0.6αt; Forward, forward motion consists >55% of actions; Lateral, otherwise.
Figure 5.
Figure 5.
Novelty management principles in the whisker (Deutsch et al., 2012) and locomotion (Fonio et al., 2009) systems. a, Top, Example of whisking trajectory (i.e., angle as a function of time; red circles denote contact with a pole. Bottom, Novelty flow calculated from the trajectory; red crosses denote maximal novelty flow. Vertical lines denote whisk (excursion) beginning. b, Top, Example of locomotion trajectory, described in normalized polar coordinates of angle (blue) and radius (red) in a circular novel arena. Bottom, Novelty flow calculated from the trajectory; red crosses denote maximal novelty flow. Vertical lines denote entry (excursion) beginning. c, d, Difference between the novelty SNR of experimental and control animals in the whisking (c) and locomotion (d) systems; averaged over sessions (whisking system), animals (locomotion system), and 20 repetitions per session/animal for the controls (see text). Error bars denote SEM, ***p < 0.001. e, f, Dynamics of inbound movements, time aligned to the last point of maximal novelty flow, where for each data point in each excursion we calculated its spatial distance from the starting point of the excursion (error bars denote SEM). e, Change in angle in the inbound portion. f, Change in Cartesian distance from the home cage in the inbound portion. g, Percentage of excursions according to first (left), second (middle), and third (right) visited novelty zones: the exit from the home cage is the High novelty zone (red); the circumference of the arena is Medium novelty zone (purple); the open space is the Low novelty zone (blue).
Figure 6.
Figure 6.
Behavior upon first touch in life with a vertical metal pole during an exploration excursion out of the home cage. a, Top, An example of 3 successive palpations. Numerals and colors denote which whisker column, either on the left (L) or right (R) side, touched the pole, where gray (midline) denotes contact with the nose. The white curve represents the distance of the center of the head from the object as a function of time, overlaid with the contact events displayed above. Bottom, Example images from the recorded films at different times. Snout (white contour) is automatically tracked, whereas the stationary object (green contour) is manually marked. Left, The mouse is distant from the pole and does not touch it. Middle, The mouse is lightly touching the pole (blue circle). Right, The mouse is touching the pole with its nose. b, Comparison of the sum of contact durations between experiment and model during the first and second palpations. Experimental results present the average over 11 mice (error bars denote SEM, **p < 0.02), model results averaged over 10 runs with accumulated novelty wth uniformly drawn from the range of [8,9] bits and σwhisker = 0.001. Model times were normalized by first palpation duration. c, The first sequence of contact durations of a mouse as a function of contact number. The dashed red vertical line denotes the end of the first palpation episode. d, Same as c averaged over all mice (n = 11). Black line denotes exponential fit, aen/b (a = 6.54 ms, b = 7.37 contacts), where dashed red vertical line represents b.

Similar articles

Cited by

References

    1. Ahissar E, Knutsen PM. Object localization with whiskers. Biol Cybern. 2008;98:449–458. doi: 10.1007/s00422-008-0214-4. - DOI - PubMed
    1. Andersen OK. Studies of the organization of the human nociceptive withdrawal reflex. Focus on sensory convergence and stimulation site dependency. Acta Physiol (Oxf) 2007;189:1–35. doi: 10.1111/j.1748-1716.2007.01706.x. - DOI - PubMed
    1. Aston-Jones G, Cohen JD. An integrative theory of locus coeruleus-norepinephrine function: adaptive gain and optimal performance. Annu Rev Neurosci. 2005;28:403–450. doi: 10.1146/annurev.neuro.28.061604.135709. - DOI - PubMed
    1. Bahar A, Dudai Y, Ahissar E. Neural signature of taste familiarity in the gustatory cortex of the freely behaving rat. J Neurophysiol. 2004;92:3298–3308. doi: 10.1152/jn.00198.2004. - DOI - PubMed
    1. Baldassarre G. What are intrinsic motivations? A biological perspective. Paper presented at IEEE International Conference on Development and Learning (ICDL); August; Frankfurt am Main, Germany. 2011.

Publication types

LinkOut - more resources