. 2014 Sep 17;34(38):12701-15.
doi: 10.1523/JNEUROSCI.0229-14.2014.

The visual input to the retina during natural head-free fixation

Affiliations

The visual input to the retina during natural head-free fixation

Murat Aytekin et al. J Neurosci. .

Abstract

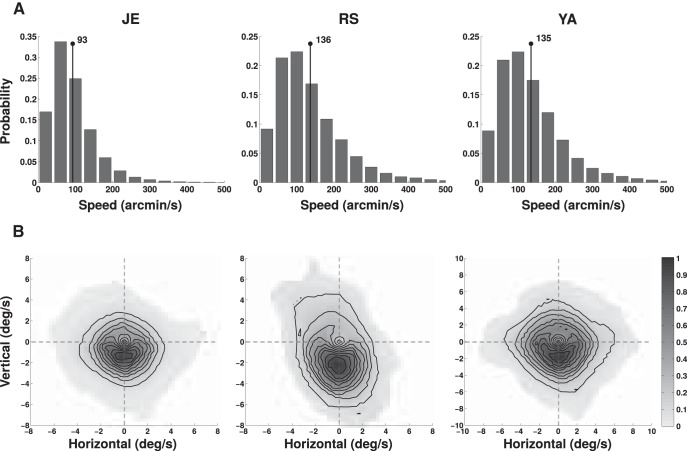
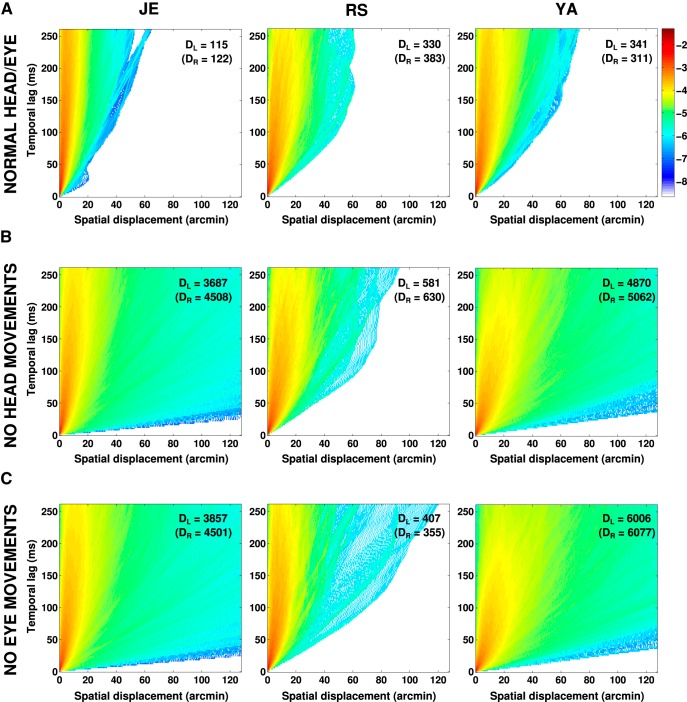
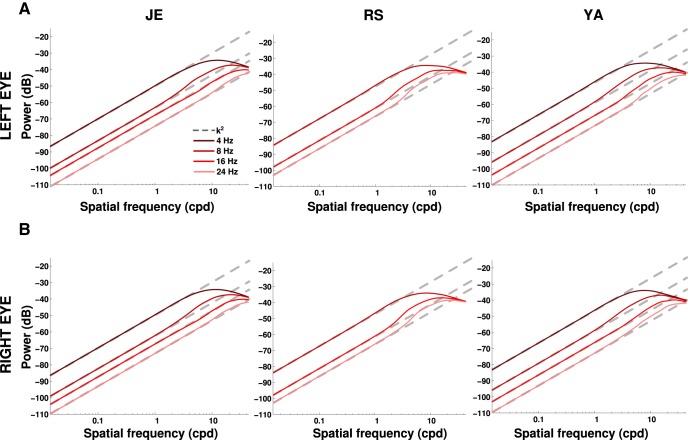
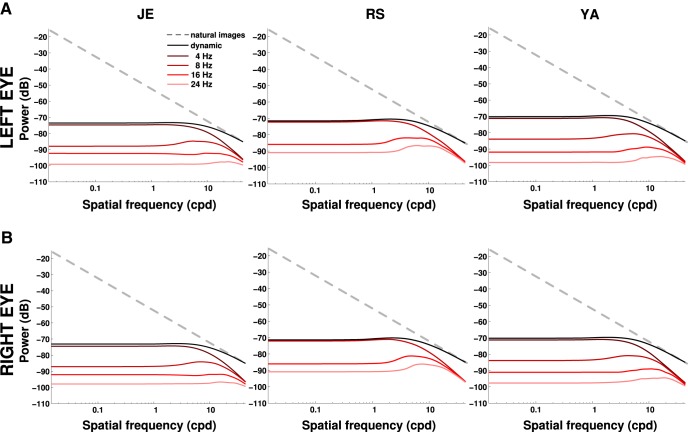
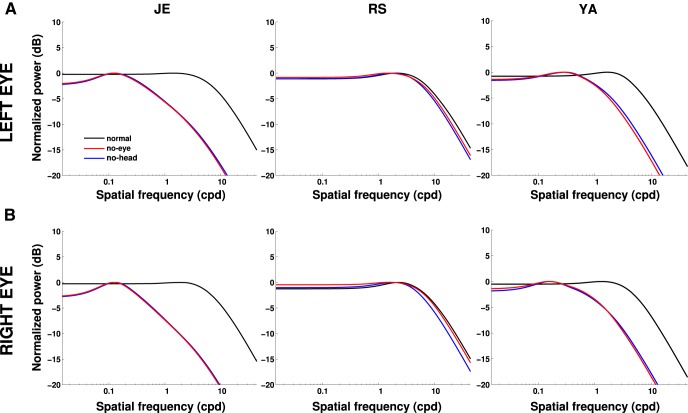
Head and eye movements incessantly modulate the luminance signals impinging onto the retina during natural intersaccadic fixation. Yet, little is known about how these fixational movements influence the statistics of retinal stimulation. Here, we provide the first detailed characterization of the visual input to the human retina during normal head-free fixation. We used high-resolution recordings of head and eye movements in a natural viewing task to examine how they jointly transform spatial information into temporal modulations. In agreement with previous studies, we report that both the head and the eyes move considerably during fixation. However, we show that fixational head and eye movements mostly compensate for each other, yielding a spatiotemporal redistribution of the input power to the retina similar to that previously observed under head immobilization. The resulting retinal image motion counterbalances the spectral distribution of natural scenes, giving temporal modulations that are equalized in power over a broad range of spatial frequencies. These findings support the proposal that "ocular drift," the smooth fixational motion of the eye, is under motor control, and indicate that the spatiotemporal reformatting caused by fixational behavior is an important computational element in the encoding of visual information.

Keywords: eye movements; head movements; microsaccade; ocular drift; retina; visual fixation.


Figures

Figure 1.
Figure 1.
Reconstruction of the retinal input. A, Head rotations were expressed by the Fick angles (yaw Φz, pitch Φy, and roll Φx) necessary to align a reference frame, H° = {hx°, hy°, hz°}, established during an initial calibration procedure with a head-fixed frame, H = {hx, hy, hh}. Eye movements, defined as eye-in-the-head rotations, were measured by the horizontal and vertical rotations, αH and αV, necessary to align H with an eye-centered reference frame E, oriented so that its first basis vector ex coincided with the line of sight. B, Joint measurement of the orientation and position of the head enabled localization of the centers of rotations of the two eyes (C) and their optical axes (ex). The retinal image was estimated by placing the eye model of Gullstrand (1924) at the current eye location. N1 and N2 optical nodal points, T target, P target's projection on the retina.
Figure 2.
Figure 2.
Examples of head and eye movements and resulting image motion on the retina during an experimental trial. A, Head translations. B, Head rotations. Head movements were measured relative to a room-fixed Cartesian reference system, as shown in Figure 1. C, Eye displacements, defined as the translational motion of the eye resulting from head movements. Traces represent the spatial trajectories followed by the center of rotation of each eye. D, Rotational eye movements, defined as horizontal and vertical rotations of the eye within the head. E, Retinal image motion. Trajectory of the retinal projection of one LED target. F, Enlargement of a portion of the trace in E (shaded region). For comparison, the trajectory obtained by artificially eliminating head movements (i.e., by holding head position and orientation signals constant for the entire fixation interval) is also shown. In all panels, angles are expressed in degrees, and translations in millimeters.
Figure 3.
Figure 3.
Fixational head movements. A, B, Distributions of instantaneous translational velocities along the three Cartesian axes (A) and instantaneous angular velocities for yaw, pitch, and roll rotations (B). Each histogram shows the characteristics of motion on an individual axis. Each column shows data from one subject. Numbers and lines in each panel represent the means and SDs of the distributions.
Figure 4.
Figure 4.
Fixational eye movements. A, B, Distributions of instantaneous translational (A) and rotational (B) eye velocities. Data refer to the displacements in the eye-center position caused by head movements in A and to eye-in-head rotations in B. Each histogram shows the velocity on 1 degree of freedom, with its mean ± SD reported in each panel. Each column shows data from one subject. Data refer to the right eye; the left eye moved in a highly similar manner.
Figure 5.
Figure 5.
Precision of fixation. Two-dimensional distributions of displacements of the retinal projection of the fixated target. Retinal traces were aligned by positioning their initial point at the origin of the Cartesian axes. The marginal probability density functions are plotted on each axis. The insert panels give the probability of finding the retinal stimulus displaced by any given angle relative to its initial position. Each column shows data from one subject.
Figure 6.
Figure 6.
Velocity of retinal drift. A, Distributions of instantaneous drift speeds (the modulus of the retinal velocity vector). The numbers in each panel represent the mean speed values for each observer. B, Two-dimensional distributions of retinal velocity. The intensity of each pixel represents the normalized frequency that the fixation target moved with velocity equal to the vector given by the pixel position. Lines represent iso-frequency contours. Each column shows data from one subject.
Figure 7.
Figure 7.
Probability distributions of retinal image motion during intersaccadic fixation. In each panel, the color of a pixel at coordinates (x, t) represents the probability (in common log scale) that the eye moved by a distance x in an interval t. A, Probability distributions obtained during head-free fixation when both head and eye movements normally contributed to the motion of the retinal image. B, C, Same data as in A after removal of head (B) or eye (C) movements by replacing the original traces with equivalent periods of immobility. The numbers in each panel represent the diffusion constants measured in the two eyes of the Brownian process that best fitted (least squares) the distributions. Each column shows data from one subject.
Figure 8.
Figure 8.
Power redistribution in the retinal input resulting from fixational head and eye movements for an image consisting of a single point (the fixated LED target). In each panel, different curves represent different temporal frequency sections. Each column shows data from one subject; rows A and B show the two retinas. In all retinas, the power available at any temporal frequency increased proportionally to the square of spatial frequency (dashed lines).
Figure 9.
Figure 9.
Frequency content of the average retinal input during normal fixation in the natural world. The power of the external stimulus (natural images, dashed lines) is compared with the total power that becomes available at nonzero temporal frequencies because of fixational instability (dynamic, solid black line). The power distributions at individual temporal frequency sections are also shown. Each column shows data from one subject; rows A and B show the two retinas. Fixational head and eye movements whiten the retinal stimulus over a broad range of spatial frequencies.
Figure 10.
Figure 10.
Effect of compensatory head and eye movements. The total power that becomes available at nonzero temporal frequencies because of the joint effect of head and eye movements (normal, replotted from Fig. 9) is compared with that obtained after artificial elimination of either eye (no eye) or head movements (no head). Each column shows data from one subject; rows A and B show the two retinas.

References

    1. Ahissar E, Arieli A. Figuring space by time. Neuron. 2001;32:185–201. doi: 10.1016/S0896-6273(01)00466-4. - DOI - PubMed
    1. Ahissar E, Arieli A. Seeing via miniature eye movements: a dynamic hypothesis for vision. Front Comput Neurosci. 2012;6:89. doi: 10.3389/fncom.2012.00089. - DOI - PMC - PubMed
    1. Angelaki DE, Cullen KE. Vestibular system: the many facets of a multimodal sense. Annu Rev Neurosci. 2008;31:125–150. doi: 10.1146/annurev.neuro.31.060407.125555. - DOI - PubMed
    1. Arend LE., Jr Spatial differential and integral operations in human vision: implications of stabilized retinal image fading. Psychol Rev. 1973;80:374–395. doi: 10.1037/h0020072. - DOI - PubMed
    1. Atick JJ, Redlich AN. What does the retina know about natural scenes? Neural Comput. 1992;4:196–210. doi: 10.1162/neco.1992.4.2.196. - DOI

Publication types

LinkOut - more resources