. 2014 Sep 17;34(38):12865-76.
doi: 10.1523/JNEUROSCI.1494-14.2014.

Hey1 and Hey2 control the spatial and temporal pattern of mammalian auditory hair cell differentiation downstream of Hedgehog signaling

Affiliations

Hey1 and Hey2 control the spatial and temporal pattern of mammalian auditory hair cell differentiation downstream of Hedgehog signaling

Ana Benito-Gonzalez et al. J Neurosci. .

Abstract

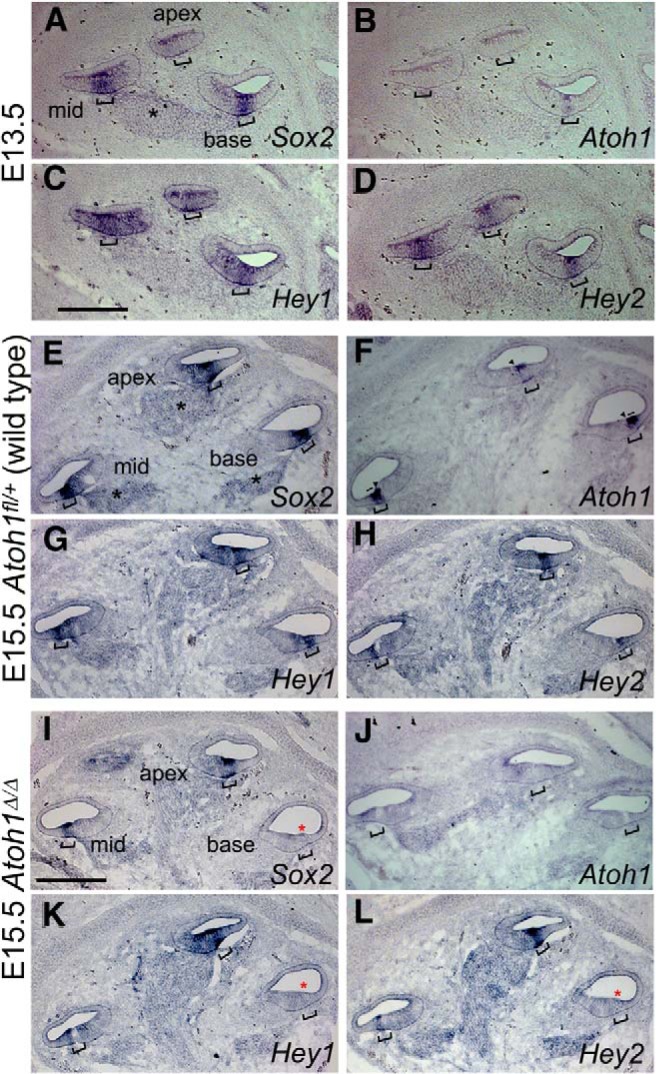
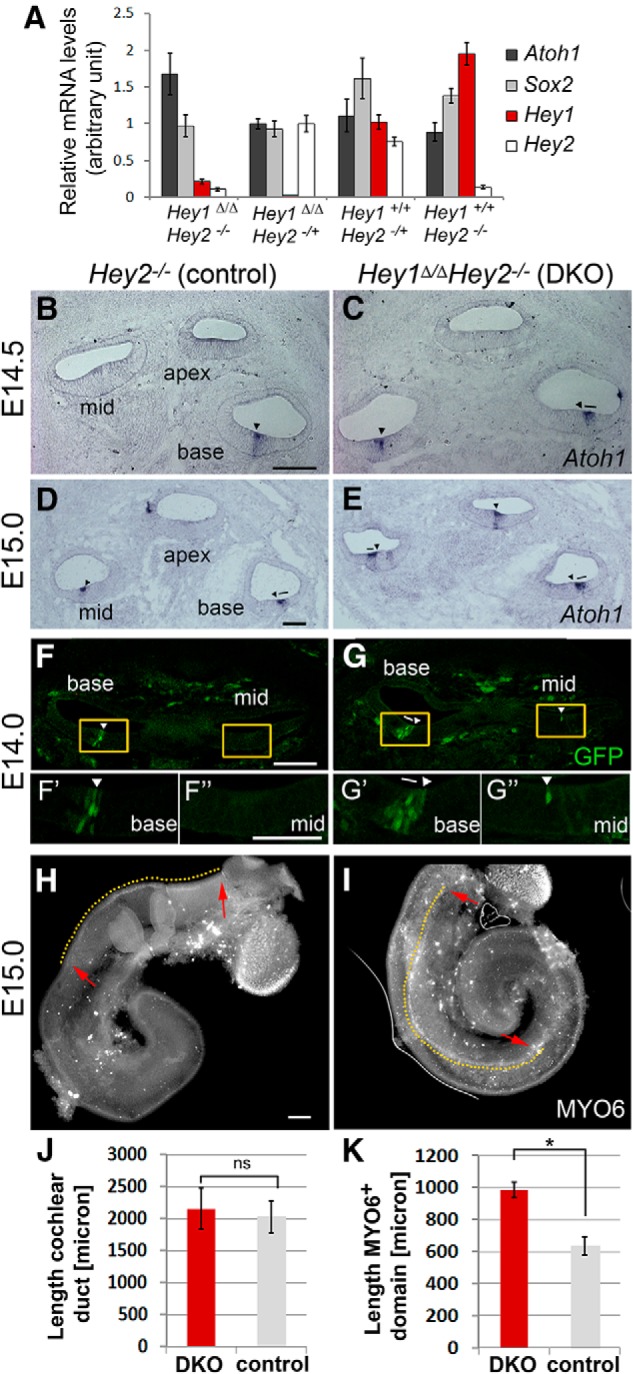
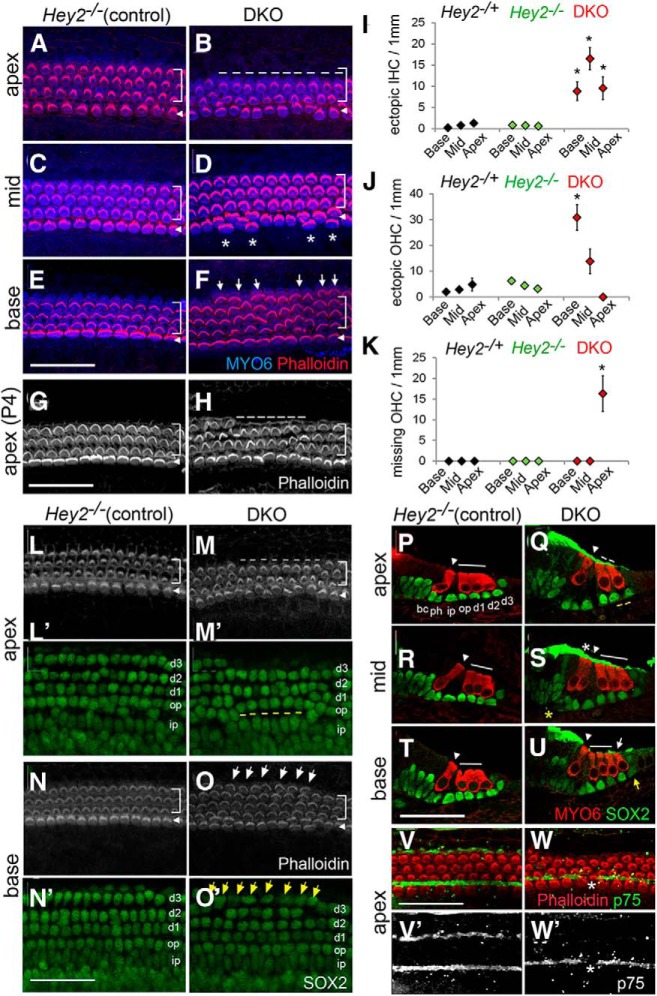
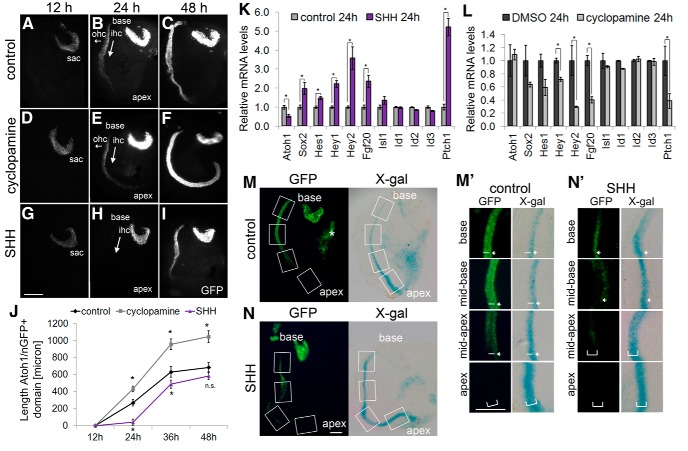
Mechano-sensory hair cells (HCs), housed in the inner ear cochlea, are critical for the perception of sound. In the mammalian cochlea, differentiation of HCs occurs in a striking basal-to-apical and medial-to-lateral gradient, which is thought to ensure correct patterning and proper function of the auditory sensory epithelium. Recent studies have revealed that Hedgehog signaling opposes HC differentiation and is critical for the establishment of the graded pattern of auditory HC differentiation. However, how Hedgehog signaling interferes with HC differentiation is unknown. Here, we provide evidence that in the murine cochlea, Hey1 and Hey2 control the spatiotemporal pattern of HC differentiation downstream of Hedgehog signaling. It has been recently shown that HEY1 and HEY2, two highly redundant HES-related transcriptional repressors, are highly expressed in supporting cell (SC) and HC progenitors (prosensory cells), but their prosensory function remained untested. Using a conditional double knock-out strategy, we demonstrate that prosensory cells form and proliferate properly in the absence of Hey1 and Hey2 but differentiate prematurely because of precocious upregulation of the pro-HC factor Atoh1. Moreover, we demonstrate that prosensory-specific expression of Hey1 and Hey2 and its subsequent graded downregulation is controlled by Hedgehog signaling in a largely FGFR-dependent manner. In summary, our study reveals a critical role for Hey1 and Hey2 in prosensory cell maintenance and identifies Hedgehog signaling as a novel upstream regulator of their prosensory function in the mammalian cochlea. The regulatory mechanism described here might be a broadly applied mechanism for controlling progenitor behavior in the central and peripheral nervous system.

Keywords: Atoh1; Hedgehog signaling; Hey1; Hey2; hair cells; inner ear cochlea.


Figures

Figure 1.
Figure 1.
Hey1 and Hey2 downregulation in prosensory cells occurs independently of Atoh1. A–D, Hey1 and Hey2 transcripts are highly expressed in prosensory cells. At E13.5, Hey1 (C) and Hey2 (D) are coexpressed with Sox2 (A) in the prosensory domain (bracket) and Atoh1 (B) begins to be upregulated in the cochlear base. A, *Sox2 expression in spiral ganglion neurons. Scale bar, 200 μm. E–L, Downregulation of Hey1 and Hey2 occurs in the absence of HC differentiation. In E15.5, Atoh1fl/+ (wild-type) cochlear tissue, basal-to-apical upregulation of Atoh1 (F) in IHCs (arrowhead) and OHCs (bar) coincides with the basal-to-apical downregulation of Hey1 (G) and Hey2 (H) in Sox2-positive HC and SC precursors (E, bracket). E, *Sox2 expression in ganglion neurons. In E15.5, Atoh1 mutant (Atoh1Δ/Δ) cochlear tissue initial downregulation of Hey1 (K) and Hey2 (L) in Sox2-positive HC and SC precursors (I, bracket) occurs in the absence of Atoh1 (J). Red asterisks indicate degenerated sensory epithelia in the Atoh1 mutant cochlear base. Scale bars, 200 μm.
Figure 2.
Figure 2.
Loss of Hey1 and Hey2 results in accelerated auditory HC differentiation. A, qPCR analysis of relative Atoh1, Sox2, Hey1, and Hey2 mRNA levels in Hey1Δ/Δ Hey2−/− (DKO) and control (Hey1Δ/Δ Hey2−/+, Hey1+/+ Hey2−/+ and Hey1+/+ Hey2−/−) cochlear epithelia, Stage E13.5. Data are mean ± SEM. B–E, ISH-based analysis of Atoh1 expression pattern in Hey2−/− (control) (B, D) and Hey1Δ/Δ Hey2−/− (DKO) (C, E) cochlear sections, Stage E14.5 (B, C) and Stage E15.0 (D, E). At both E14.5 and E15.0, Atoh1 expression extends further apically in DKO (C, E) than control (B, D) cochlear sections. Scale bar, 100 μm. F–G″, Low-power (F, G) and high-power (F′, F″, G′, G″) confocal images of HC-specific Atoh1/nGFP reporter expression (green) in E14.0 Hey2−/− (control; F, F′,F″) and E14.0 Hey1Δ/Δ Hey2−/− (DKO; G, G′, G″) cochlear sections. F, G, Yellow boxes represent location of the high-power images (F′, F″, G′, G″). Scale bar, 100 μm. H–I, Low-power images of E15.0 Hey2−/− (I) and E15.0 DKO (H) cochlear epithelial ducts immunostained for myosin VI (MYO6, white). Yellow dotted line indicates MYO6-positive sensory domains; red arrows indicate beginning and end. Sale bar, 100 μm. J, K, Quantification of cochlear length and extent of HC differentiation in E15.0 Hey1Δ/Δ Hey2−/− (DKO) and Hey2−/+ and Hey2−/− (control) littermates. Graphs represent cochlear duct length (J) and length of MYO6-positive sensory domain (K) for control (gray bar) and DKO (red bar) cochlear ducts. Data are mean ± SEM. n = 4 or 5 cochlear explants from three independent experiments. *p ≤ 0.05. n.s., Not significant.
Figure 3.
Figure 3.
Loss of Hey1 and Hey2 results in complex HC and SC patterning defects. A–W′, HC and SC phenotype was analyzed in the early postnatal control (Hey2−/− and Hey2−/+) and DKO cochlea in whole mounts (surface preparations) and sections. HCs were labeled using MYO6 and phalloidin staining, and SCs were labeled using SOX2 staining. HC and SC subtypes were identified by morphology and their relative location within the sensory epithelium. Arrowheads indicate IHC domain; brackets indicate OHC domain. Dashed line indicates missing OHCs (white) and missing oSCs (yellow). Asterisks label ectopic IHCs (white) and ectopic iSCs (yellow). Arrows indicate ectopic OHCs (white) and ectopic oSCs (yellow). bc, inner border cell; ph, inner phalangeal cell; ip, inner pillar cell; op, outer pillar cell; d1–3, Deiters cells. A–F, HC phenotype in Hey2−/− (A, C, E) and DKO (B, D, F) cochlear surface preparations, Stage P0. Shown are high-power confocal images of MYO6 and phalloidin-positive HC layer at apical (A, B), mid (C, D), and basal (E, F) positions. Scale bar, 50 μm. G, H, HC phenotype in Hey2−/− (G) and DKO (H) cochlear surface preparations, Stage P4. Shown are high-power confocal images of the HC layer (phalloidin, white) at an apical location. Scale bar, 50 μm. I–K, Quantification of ectopic IHCs (I), ectopic OHCs (J), and missing OHCs (K) in DKO (red diamonds) and Hey2−/− (green diamonds) and Hey2−/+ (black diamonds) cochlea Stage P0–P2. Cochlear surface preparations were divided into three segments (base, mid, apex), and ectopic and missing HCs were counted for each segment per 1 mm. Data are mean ± SEM (n = 7, three independent experiments). *p ≤ 0.05. L–O′, HC and SC phenotype in DKO (M, M′, O, O′) and Hey2−/− (control) (L, L′, N, N′) cochlear surface preparations, Stage P0. Shown are confocal images of the HC layer (phalloidin, white) and corresponding (′) SC layer (SOX2, green) of apical (L–M′) and basal segments (N–O′). Scale bar, 50 μm. P–U, SC phenotype in Hey2−/− (control) (P, R, T) and DKO (Q, S, U) cochlear sections, Stage P0. Shown are confocal images of apical (P,Q), mid (R, S), and basal (T, U) cochlear sections immunostained with HC marker MYO6 (red) and SC marker SOX2 (green). Scale bar, 50 μm. V–W′, Pillar cell phenotype in Hey2−/+ (control) (V, V′) and DKO (W, W′) cochlear surface preparations, Stage P0. Shown are merged and single (′) channel confocal images of HC layer in cochlear apex. Phalloidin-positive HC bundles are shown in red, and p75 (NGFR)-positive pillar cell heads are shown in green and white (′). The pillar cell-specific p75 staining is disrupted by an ectopic HC (white asterisk) in the DKO cochlea (W, W′). Scale bar, 50 μm.
Figure 4.
Figure 4.
Loss of Hey1 and Hey2 does not alter prosensory cell proliferation. A–G, Loss of Hey1 and Hey2 does not alter the apical-to-basal gradient of prosensory cell cycle exit. Incorporation of EdU in prosensory cells was analyzed in Hey2−/− (control) (A, C, E) and Hey1Δ/Δ Hey2−/− (DKO) (B, D, F) animals. EdU was injected at E13.5, and E15.5 cochlear sections were immunostained for prosensory marker SOX2 (green) and processed for EdU labeling (red). Shown are both merged and EdU only images (′) for the cochlear apex (A–B′), mid (C–D′), and base (E–F′). White bracket indicates prosensory domain. Scale bar, 100 μm. G, Quantification of EdU incorporation in Hey2−/− control (gray bar) and DKO (red bar) prosensory cells in the cochlear apex, mid, and base. Data are mean ± SEM (n = 3, two independent experiments). n.s., Not significant. H–T, Loss of Hey1 and Hey2 does not alter proliferation rate of HC and SC precursors. EdU was injected at E12.5 and EdU incorporation in HCs and SCs was analyzed at E18.5 in control (Hey2−/+and Hey1Δ/Δ Hey2−/+) and DKO cochlear surface preparations. H–Q, EdU incorporation in E18.5 Hey2−/+ (control) (H–L) and DKO (M–Q) cochlear sensory epithelium. Shown are high-power confocal images of MYO6-positive HC layer (green) at the cochlear apical tip (H, M), apex (I, N), mid-apex (J, O), mid-base (K, P), and base (L, Q). Arrows point to IHCs; brackets indicate OHCs. EdU-positive nuclei are shown in red. Scale bar, 50 μm. R–T, Quantification of EdU incorporation in IHCs (R), OHCs (S), and oSCs (T) in E18.5 Hey2−/+ (light gray), Hey1Δ/Δ Hey2−/+ (dark gray), and DKO (red). Data are mean ± SEM (n = 3, two independent experiments). *p ≤ 0.05. n.s., Not significant.
Figure 5.
Figure 5.
Hedgehog signaling positively regulates Hey1 and Hey2 expression in prosensory cells. A–I, Effects of Hedgehog signaling on HC differentiation. HC-specific Atoh1/nGFP reporter expression was monitored in control (A–C), cyclopamine (D–F), and SHH-treated (G–I) E13.0 cochlear explants over a 48 h time period. Shown are low-power fluorescent images of Atoh1/nGFP (GFP, white) at 12 h (A, D, G), 24 h (B, E, H), and 48 h (C, F, I). Long arrows indicate basal-to-apical gradient; short arrows indicate medial-to-lateral gradient. Locations of IHCs (ihc) and OHCs (ohc) and basal (base) to apical (apex) extent of cochlear duct are indicated. Atoh1/nGFP is also expressed in the vestibular sacculus (sac). Scale bar, 200 μm. J, Quantification of basal-to-apical extent of Atoh1/nGFP expression in control (black diamond), cyclopamine (gray square), and SHH (purple triangle) treated cochlea explants after 12, 24, 36, and 48 h. Data mean ± SEM (n = 5). *p ≤ 0.05. n.s., Not significant. K, L, Hedgehog signaling positively regulates Hey1 and Hey2 mRNA expression. K, qPCR-based analysis of cochlear epithelial-specific gene expression in SHH-treated (Shh, purple bar) and untreated (control, gray bar) E13.5 cochlear explants after 24 h in vitro. Data are mean ± SEM (n = 4, two independent experiments). *p ≤ 0.05. L, qPCR based analysis of cochlear epithelial-specific gene expression in cyclopamine (light gray bar) and vehicle control (DMSO, dark gray bar) treated E13.5 cochlear explants after 24 h in vitro. Data are mean ± SEM (n = 4, two independent experiments). *p ≤ 0.05. M–N′, Hedgehog signaling maintains Hey2 expression in prosensory cells. E13.5 Atoh1/nGFP transgenic Hey2LacZ/+ cochlear explants were cultured with (N, N′) and without SHH (M, M′) for 48 h. Shown are low-power (M, N) and high-power (M′, N′) images of HC-specific Atoh1/nGFP reporter expression (GFP, green) and Hey2-LacZ reporter expression (X-gal, blue). M, N, White boxes represent the fields along the cochlear duct shown in M′ and N′. M, *Auto-fluorescent debris. M′, N′, White brackets indicate undifferentiated prosensory domain; white arrowheads indicate location of GFP-positive IHCs; white bars indicate location of GFP-positive OHCs. Scale bar, 100 μm.
Figure 6.
Figure 6.
FGFR signaling acts downstream of Hedgehog signaling in Hey1 and Hey2 regulation. A–I, FGFR signaling is required for SHH-mediated inhibition of HC differentiation. HC-specific Atoh1/nGFP reporter expression was monitored in E13.5 cochlear explants treated with vehicle control DMSO (A, E), FGFR inhibitor SU5402 (B, F), SHH + DMSO (C, G), and SU5402 + SHH (D, H) over a 24 h time period. Shown are low-power fluorescent images of HC-specific Atoh1/nGFP expression (GFP, white) at 12 h (A–D) and 24 h (E–H). Long arrow indicates basal-to-apical gradient; short arrow indicates medial-to-lateral gradient. I, Quantification of basal-to-apical extent of HC-specific Atoh1/nGFP expression in DMSO (dark gray bar), SHH + DMSO (purple bar), SU5402 (light gray bar), and SHH + SU5402 (white bar). Error bars indicate mean ± SEM (n = 5). *p ≤ 0.05. n.s., Not significant. J, FGFR signaling is required for SHH-mediated activation of Hey1 and Hey2 transcription. Shown is qPCR-based analysis of Hey1 and Hey2 mRNA levels in control (dark gray bar), SHH (purple bar), SU5402 (light gray bar), and SHH + SU5402 (white bar) treated cochlear epithelia after a 24 h treatment. Scale bar, 200 μm. Errors bars indicate mean ± SEM (n = 3, two independent experiments). *p ≤ 0.05. n.s., Not significant.

References

    1. Anniko M. Postnatal maturation of cochlear sensory hairs in the mouse. Anat Embryol. 1983;166:355–368. doi: 10.1007/BF00305923. - DOI - PubMed
    1. Basch ML, Ohyama T, Segil N, Groves AK. Canonical Notch signaling is not necessary for prosensory induction in the mouse cochlea: insights from a conditional mutant of RBPjkappa. J Neurosci. 2011;31:8046–8058. doi: 10.1523/JNEUROSCI.6671-10.2011. - DOI - PMC - PubMed
    1. Bermingham NA, Hassan BA, Price SD, Vollrath MA, Ben-Arie N, Eatock RA, Bellen HJ, Lysakowski A, Zoghbi HY. Math1: an essential gene for the generation of inner ear hair cells. Science. 1999;284:1837–1841. doi: 10.1126/science.284.5421.1837. - DOI - PubMed
    1. Bok J, Zenczak C, Hwang CH, Wu DK. Auditory ganglion source of Sonic hedgehog regulates timing of cell cycle exit and differentiation of mammalian cochlear hair cells. Proc Natl Acad Sci U S A. 2013;110:13869–13874. doi: 10.1073/pnas.1222341110. - DOI - PMC - PubMed
    1. Cai T, Seymour ML, Zhang H, Pereira FA, Groves AK. Conditional deletion of atoh1 reveals distinct critical periods for survival and function of hair cells in the organ of Corti. J Neurosci. 2013;33:10110–10122. doi: 10.1523/JNEUROSCI.5606-12.2013. - DOI - PMC - PubMed

Publication types

MeSH terms