

Assessment of ventricular repolarization inhomogeneity in patients with mitral valve prolapse: value of T wave peak to end interval
- PMID: 25232403
- PMCID: PMC4161563
Assessment of ventricular repolarization inhomogeneity in patients with mitral valve prolapse: value of T wave peak to end interval
Abstract
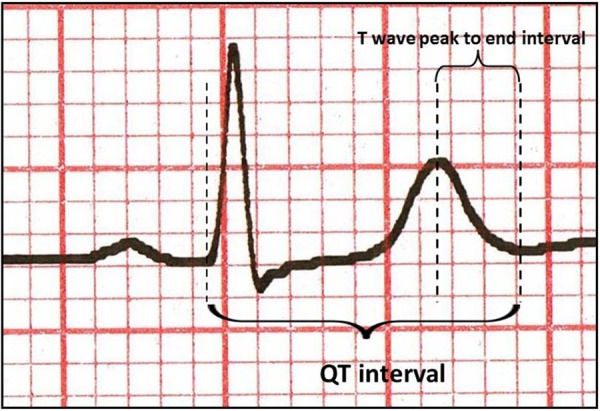
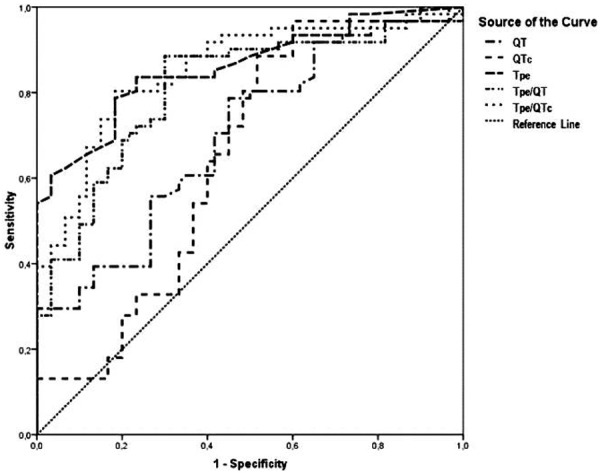
Mitral valve prolapse (MVP) has been long known for causing susceptibility for ventricular arrhythmogenesis, and this risk was evaluated by various methods, mostly by using QT interval related measurements on surface electrocardiogram. T wave peak to end (Tp-e) interval is a relatively new marker for ventricular arrhythmogenesis and repolarization heterogeneity. Prolongation of this interval represents a period of potential vulnerability to re-entrant ventricular arrhythmias. However, there is no information available assessing the Tp-e interval and related calculations in patients with MVP. The aim of this study was to assess ventricular repolarization in patients with MVP by using QT, corrected QT (QTc) and Tp-e interval, Tp-e/QT ratio, and Tp-e/QTc ratio. Electrocardiogram of consecutive 72 patients, who were followed by outpatient clinic because of mitral valve prolapse, were obtained and scanned. Electrocardiograms of age and sex matched 60 healthy control individuals were also gained for comparison. QT, QTc, Tp-e/QT and Tp-e/QTc were calculated. Baseline characteristics were similar in both groups. QT (405.1±64.3 vs. 362.1±39.1; p<0.001), QTc (457.6±44.4 vs. 428.3±44.7; p<0.001), Tp-e (100.2±22.1 vs. 74.6±10.2; p<0.001) and Tp-e/QT (0.24 vs. 0.20; p<0.001) and Tp-e/QTc (0.21 vs. 0.17; p<0.001) were significantly worse in MVP group. Our study revealed that Tp-e interval and Tp-e/QT ratio were increased in MVP patients. Tp-e interval and Tp-e/QT ratio might be a useful marker of cardiovascular morbidity and mortality due to ventricular arrhythmias in patients with MVP.
Keywords: Prolapse; T wave peak to end; arrhythmogenesis.
Figures
Similar articles
-
Prolonged Tp-e Interval and Tp-e/QT Ratio in Children with Mitral Valve Prolapse.Pediatr Cardiol. 2016 Aug;37(6):1169-74. doi: 10.1007/s00246-016-1414-7. Epub 2016 Jun 1. Pediatr Cardiol. 2016. PMID: 27251411
-
Assessment of Transmural Dispersion of Repolarization in Children with Mitral Valve Prolapse.J Tehran Heart Cent. 2020 Apr;15(2):64-68. doi: 10.18502/jthc.v15i2.4185. J Tehran Heart Cent. 2020. PMID: 33552196 Free PMC article.
-
Prolonged Tp-e Interval, Tp-e/QT Ratio and Tp-e/QTc Ratio in Patients with Type 2 Diabetes Mellitus.Endocrinol Metab (Seoul). 2016 Mar;31(1):105-12. doi: 10.3803/EnM.2016.31.1.105. Endocrinol Metab (Seoul). 2016. PMID: 26676332 Free PMC article.
-
Assessment of Ventricular Repolarization in Sickle Cell Anemia Patients: The Role of QTc Interval, Tp-e Interval and Tp-e/QTc Ratio and Its Gender Implication.Vasc Health Risk Manag. 2020 Dec 7;16:525-533. doi: 10.2147/VHRM.S259766. eCollection 2020. Vasc Health Risk Manag. 2020. PMID: 33324066 Free PMC article.
-
Evaluation of Tp-Te interval and Tp-Te/QTc ratio in patients with coronary artery ectasia.Int J Clin Exp Med. 2014 Sep 15;7(9):2865-70. eCollection 2014. Int J Clin Exp Med. 2014. PMID: 25356150 Free PMC article.
Cited by
-
Prevalence and characteristics of mitral valve prolapse in military young adults in Taiwan of the CHIEF Heart Study.Sci Rep. 2021 Feb 1;11(1):2719. doi: 10.1038/s41598-021-81648-z. Sci Rep. 2021. PMID: 33526804 Free PMC article.
-
Comparison of Cardiorespiratory Fitness between Patients with Mitral Valve Prolapse and Healthy Peers: Findings from Serial Cardiopulmonary Exercise Testing.J Cardiovasc Dev Dis. 2023 Apr 13;10(4):167. doi: 10.3390/jcdd10040167. J Cardiovasc Dev Dis. 2023. PMID: 37103046 Free PMC article.
-
Comparing of Tp-Te Interval and Tp-Te/Qt Ratio in Patients with Preserved, Mid-Range and Reduced Ejection Fraction Heart Failure.Open Access Maced J Med Sci. 2019 Mar 13;7(5):752-759. doi: 10.3889/oamjms.2019.186. eCollection 2019 Mar 15. Open Access Maced J Med Sci. 2019. PMID: 30962833 Free PMC article.
-
The relationship between electrocardiographic data and mortality in children diagnosed with dilated cardiomyopathy.Eur J Pediatr. 2020 May;179(5):813-819. doi: 10.1007/s00431-020-03569-9. Epub 2020 Jan 14. Eur J Pediatr. 2020. PMID: 31938873
-
Assessment of Tp-Te Interval and Tp-Te/Qt Ratio in Patients with Aortic Aneurysm.Open Access Maced J Med Sci. 2019 Mar 13;7(6):943-948. doi: 10.3889/oamjms.2019.191. eCollection 2019 Mar 30. Open Access Maced J Med Sci. 2019. PMID: 30976337 Free PMC article.
References
-
- Savage DD, Garrison RJ, Devereux RB, Castelli WP, Anderson SJ, Levy D, McNamara PM, Stokes J 3rd, Kannel WB, Feinleib M. Mitral valve prolapse in general population. 1. Epidemiologic features: the Framingam Study. Am Heart J. 1983;106:571–576. - PubMed
-
- Devereux RB, Perloff JK, Reichek N, Josephson ME. Mitral valve prolapse. Circulation. 1976;53:749–751. - PubMed
-
- Farb A, Tang AL, Atkinson JB, McCarthy WF, Virmani R. Comparison of cardiac findings in patients with mitral valve prolapse who die suddenly to those who have congestive heart failure from mitral regurgitation and to those with fatal non-cardiac conditions. Am J Cardiol. 1992;70:234–239. - PubMed
-
- Kligfield P, Levy D, Devereux RB, Savage DD. Arrhythmias and sudden death in mitral valve prolapse. Am Heart J. 1987;113:1298–1307. - PubMed
-
- Nishimura RA, McGoon MD, Shub C, Miller FA Jr, Ilstrup DM, Tajik AJ. Echocardiographically documented mitral valve prolapse. N Engl J Med. 1985;313:1305–1309. - PubMed
LinkOut - more resources
Full Text Sources
Miscellaneous