

The complexity of human walking: a knee osteoarthritis study
- PMID: 25232949
- PMCID: PMC4169455
- DOI: 10.1371/journal.pone.0107325
The complexity of human walking: a knee osteoarthritis study
Abstract
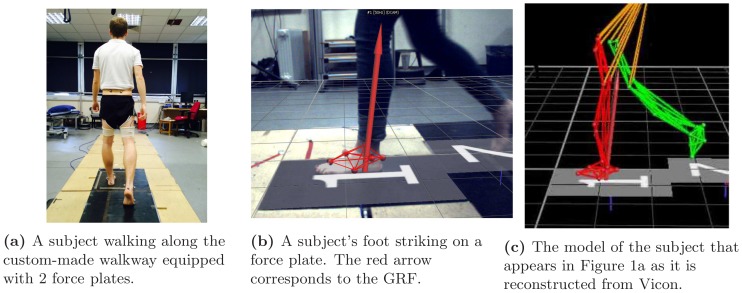
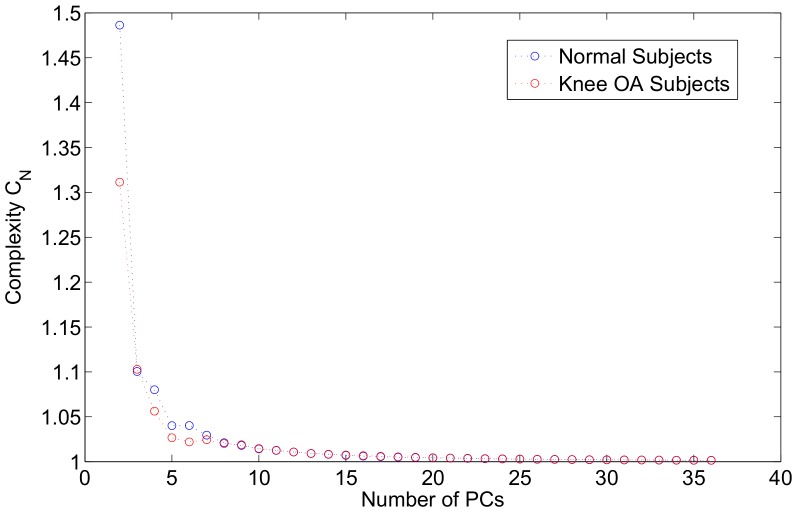
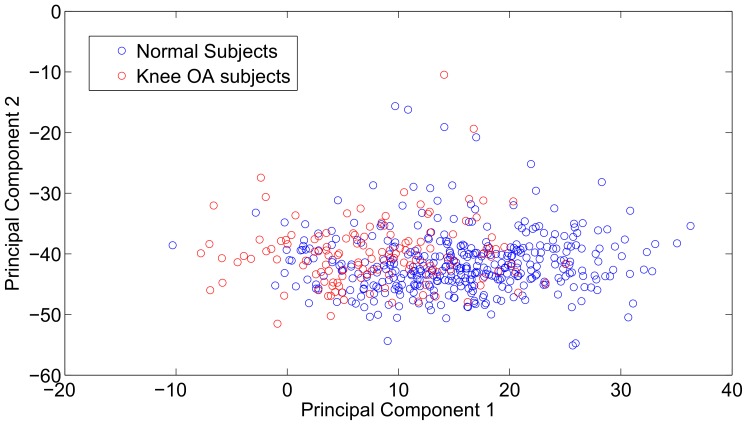
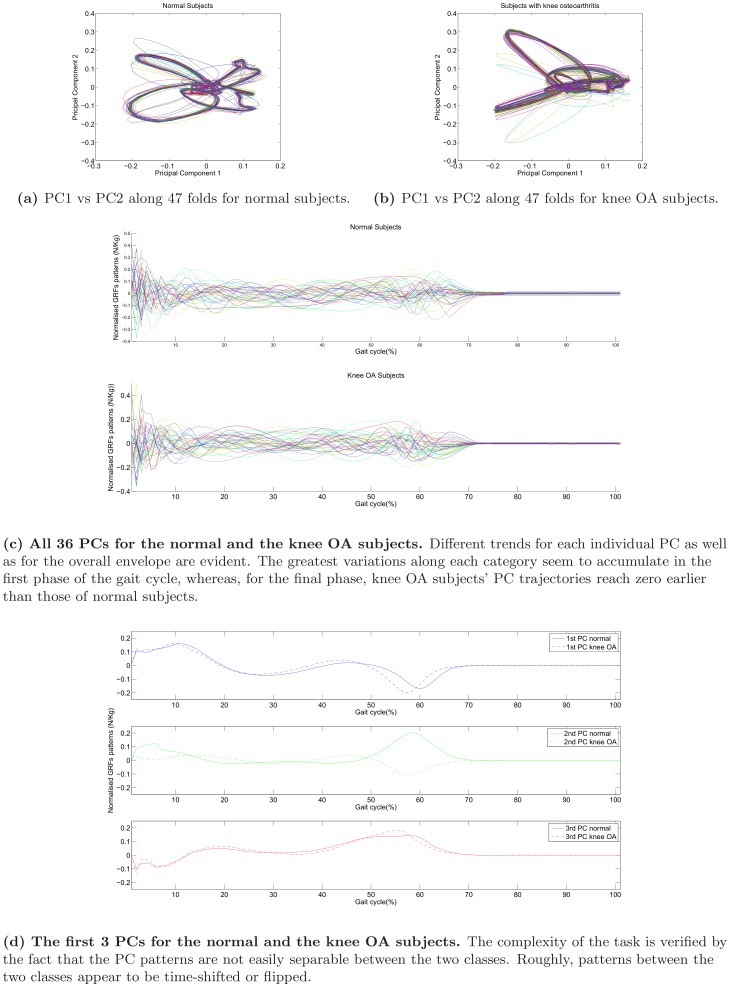
This study proposes a framework for deconstructing complex walking patterns to create a simple principal component space before checking whether the projection to this space is suitable for identifying changes from the normality. We focus on knee osteoarthritis, the most common knee joint disease and the second leading cause of disability. Knee osteoarthritis affects over 250 million people worldwide. The motivation for projecting the highly dimensional movements to a lower dimensional and simpler space is our belief that motor behaviour can be understood by identifying a simplicity via projection to a low principal component space, which may reflect upon the underlying mechanism. To study this, we recruited 180 subjects, 47 of which reported that they had knee osteoarthritis. They were asked to walk several times along a walkway equipped with two force plates that capture their ground reaction forces along 3 axes, namely vertical, anterior-posterior, and medio-lateral, at 1000 Hz. Data when the subject does not clearly strike the force plate were excluded, leaving 1-3 gait cycles per subject. To examine the complexity of human walking, we applied dimensionality reduction via Probabilistic Principal Component Analysis. The first principal component explains 34% of the variance in the data, whereas over 80% of the variance is explained by 8 principal components or more. This proves the complexity of the underlying structure of the ground reaction forces. To examine if our musculoskeletal system generates movements that are distinguishable between normal and pathological subjects in a low dimensional principal component space, we applied a Bayes classifier. For the tested cross-validated, subject-independent experimental protocol, the classification accuracy equals 82.62%. Also, a novel complexity measure is proposed, which can be used as an objective index to facilitate clinical decision making. This measure proves that knee osteoarthritis subjects exhibit more variability in the two-dimensional principal component space.
Conflict of interest statement
Figures

References
-
- Faisal AA (2012) Noise in neurons and other constraints. In: Le Novre N, editor, Computational Systems Neurobiology, Springer Netherlands. pp. 227–257.
-
- Faisal AA, Laughlin S, White J (2002) How reliable is the connectivity in cortical neural networks? In: Proceedings of the 2002 International Joint Conference on Neural Networks. volume 2, pp. 1661–1666. doi:10.1109/IJCNN.2002.1007767
Publication types
MeSH terms
Grants and funding
LinkOut - more resources
Full Text Sources
Other Literature Sources
