. 2014 Sep 18;10(9):e1004390.
doi: 10.1371/journal.ppat.1004390. eCollection 2014 Sep.

Crimean-Congo hemorrhagic fever virus entry into host cells occurs through the multivesicular body and requires ESCRT regulators

Affiliations

Crimean-Congo hemorrhagic fever virus entry into host cells occurs through the multivesicular body and requires ESCRT regulators

Olena Shtanko et al. PLoS Pathog. .

Abstract

Crimean-Congo hemorrhagic fever virus (CCHFV) is a tick-borne bunyavirus causing outbreaks of severe disease in humans, with a fatality rate approaching 30%. There are no widely accepted therapeutics available to prevent or treat the disease. CCHFV enters host cells through clathrin-mediated endocytosis and is subsequently transported to an acidified compartment where the fusion of virus envelope with cellular membranes takes place. To better understand the uptake pathway, we sought to identify host factors controlling CCHFV transport through the cell. We demonstrate that after passing through early endosomes in a Rab5-dependent manner, CCHFV is delivered to multivesicular bodies (MVBs). Virus particles localized to MVBs approximately 1 hour after infection and affected the distribution of the organelle within cells. Interestingly, blocking Rab7 activity had no effect on association of the virus with MVBs. Productive virus infection depended on phosphatidylinositol 3-kinase (PI3K) activity, which meditates the formation of functional MVBs. Silencing Tsg101, Vps24, Vps4B, or Alix/Aip1, components of the endosomal sorting complex required for transport (ESCRT) pathway controlling MVB biogenesis, inhibited infection of wild-type virus as well as a novel pseudotyped vesicular stomatitis virus (VSV) bearing CCHFV glycoprotein, supporting a role for the MVB pathway in CCHFV entry. We further demonstrate that blocking transport out of MVBs still allowed virus entry while preventing vesicular acidification, required for membrane fusion, trapped virions in the MVBs. These findings suggest that MVBs are necessary for infection and are the sites of virus-endosome membrane fusion.


Conflict of interest statement

The authors have declared that no competing interests exist.

Figures
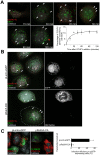
Figure 1
Figure 1. CCHFV traffics through early endosomes in a Rab5-dependent manner.
(A) SW13 cells were incubated with CCHFV for indicated times. Then, the cells were fixed, permeabilized, and treated with CellMask blue dye (grey) to stain the cytoplasm and nucleus, anti-N antibody (virus, red), and anti-EEA1 antibody (early endosomes, green). Images were obtained as Z-stacks, and three-dimensional (3D) images of cells were generated to assess colocalization between virus and endosomes. The percentages of virus particles localizing to early endosomes were counted in 20 cells in each sample, and averages and standard deviations are shown. Arrowheads point to examples of CCHFV N-EEA1 colocalization (yellow). (B) SW13 cells were transfected with either pLenti-eGFP or pRab5A-DN. After 24 h, cells were incubated with CCHFV for 30 min, fixed, and stained with anti-N antibody (red), anti-EEA1 antibody (green), and CellMask blue dye (grey). eGFP-expressing cells are pseudocolored white (right panels). Images were generated and analyzed as described in (A). The edge of the cell at lower left is indicated by a dashed line. (C) SW13 cells transfected with either pLenti-eGFP or pRab5A-CA were incubated with CCHFV for 24 h. Subsequently, samples were fixed and treated with anti-N antibody (red) to detect infected cells and CellMask blue dye (grey) to define cell boundaries. Samples were imaged as described above. The number of eGFP-expressing cells that became infected (expressing N) is shown at right. The results are averages of three independent experiments, and the bars represent standard deviations.
Figure 2
Figure 2. CCHFV localizes to and redistributes MVBs during infection.
(A) SW13 cells were incubated with CCHFV for indicated times. Subsequently, the samples were fixed, permeabilized, and stained with anti-N antibody (red), anti-CD63 antibody (MVBs, green), and CellMask blue dye (grey). Images were generated and analyzed as described in Figure 1A. Arrowheads point to examples of CCHFV N-CD63 colocalization (yellow). (B) SW13 cells were incubated with CCHFV for 2 h, then fixed and treated with anti-N antibody (red) and either anti-Alix/Aip1 (green; upper row) or anti-Lamp1 (green; lower row) antibody. To define cell boundaries, samples were stained with CellMask blue dye (grey). Images were obtained and analyzed as described in Figure 1A. Examples of N-Alix/Aip1 colocalization (yellow) are indicated with arrowheads. Colocalization was quantified by counting the number of N puncta overlapping with Alix/Aip1 or Lamp1 staining (right panel). (C) SW13 cells were transfected with either pLenti-eGFP or pRab7A-DN. Twenty-four h later, cells were incubated with CCHFV for 120 min, then fixed and stained with anti-N antibody (red), anti-CD63 antibody (green), and CellMask blue dye (grey). eGFP-expressing cells are pseudocolored white (right panel of each pair). Images were generated and analyzed as described in Figure 1A.
Figure 3
Figure 3. CCHFV infection depends on PI3K activity.
(A) To generate CCHFV-mKate2, BsrT7/5 cells transfected with pT7-mKate2, pcDNA-N, and pcDNA-L were either mock-infected or infected with CCHFV. After 48 h, supernatants were transferred onto SW13 cells for 24 h. Cells were subsequently fixed, stained with Hoechst 33342 dye to identify nuclei, and photographed (left and middle panels). To assess the effect of pharmacological inhibitors on CCHFV-mKate2 infection, SW13 cells were pretreated with one of the following: bafilomycin A (20 nM), EIPA (10 µM), nystatin (100 µM), dynasore (200 µM), or CPZ (10 µg/mL). After 1 h, cells were incubated with the virus in the presence of the drug for 24 h. Subsequently, cells were fixed, stained with the Hoechst 33342 dye, and imaged. Numbers of nuclei and mKate2-positive (infected) cells were counted using CellProfiler software. The relative infection efficiencies were calculated by dividing the number of infected cells by the number of nuclei. The infection efficiencies are averages of three independent experiments, and standard deviations are shown (right panel). (B) SW13 cells were preincubated with DMSO or LY294002 (75 µM) for 1 h and then challenged with CCHFV-mKate2 in the presence of the drug. Twenty-four h later, cells were fixed, stained, and analyzed as in (A).
Figure 4
Figure 4. ESCRT regulators control CCHFV infection.
SW13 cells were transfected with AllStar (non-targeting) siRNA, siRNAs targeting Tsg101, Vps24, Vps4B, or Alix/Aip1, or were left untreated (mock). After 24 h, the treatment was repeated. After another 24 h, the cells were split into two sets. The next day, one set of cells was challenged with CCHFV-mKate2, and lysates were collected from the second set. (A) After an additional 24 h, infected cells were fixed, treated with the Hoechst 33342 dye to stain nuclei (right panel of each image pair), photographed, and infected cells were identified by mKate2 expression (left panel of each image pair). (B) The infection efficiencies for each sample were calculated as described in Figure 3A. (C) The host protein depletion was verified by immunoblotting with anti-Tsg101, anti-Vps24, anti-Vps4B, or anti-Alix/Aip1 antibodies, and an equal number of cells in each sample was confirmed with anti-GAPDH antibody.
Figure 5
Figure 5. ESCRT regulators control CCHFV entry.
(A) To generate VSV pseudotyped with CCHFV G (VSV-CCHFVG), 293FT cells were transfected with either pBabe-βGal (control) or pC-G. After 18 h, the cells were inoculated with a VSV-VEEVGP stock for 6 hours. The supernatants were collected 48 h after infection and incubated with SW13 cells to determine the titer of the pseudotyped virus. Luciferase activity was measured 24 h later. (B) A neutralization assay was performed by incubating VSV-CCHFVG or VSV-VEEVGP with anti-Gc antibody at the indicated dilutions for 30 min. The pseudotype-antibody mixtures were subsequently added to SW13 cells, and luciferase activity was measured 24 h later. (C) SW13 cells were preincubated with DMSO or bafilomycin A (20 nM) for 1 h and then challenged with VSV-CCHFVG in the presence of the drug. Luciferase activity was measured after 24 h. (D) SW13 cells were treated with siRNAs as described in Fig. 4. Forty-eight h later, cells were plated for assessment of host gene silencing or pseudotype infection. The following day, cells were incubated with VSV-CCHFVG or were tested for host gene silencing by immunoblotting (Figure 4C). Luciferase activity was measured 24 h after pseudotype addition to cells. The averages of three experiments and standard deviations are reported relative to mock.
Figure 6
Figure 6. Lipid transport out of MVBs is dispensable for CCHFV entry.
(A) SW13 cells were pretreated with U18666A (30 µM) for 1 h or left untreated (mock). Then, the cells were incubated with CCHFV in the presence of the drug for 24 h and subsequently fixed, permeabilized, and stained with anti-N antibody (red), anti-CD63 antibody (green), and CellMask blue dye (grey) to define cell boundaries. The samples were imaged by immunofluorescence, and an optical section through the middle of the cell is shown (left and middle panels). Relative infection efficiencies were calculated by dividing the number of infected cells by the total number of cells and are averages of three independent experiments, with error bars representing standard deviations (right panel). (B) Cells treated as described in (A) were fixed 1 h after treatment and then stained with anti-CD63 antibody (green), filipin III (red), and CellMask red dye (grey). The images were generated as described above. (C) SW13 cells were treated with U18666A (30 µM) for 1 h or left untreated (mock), then incubated with VSV-CCHFVG, VSV-EBOVGP, or VSV-LASVGP. Luciferase activity was measured 24 h after pseudotype addition.
Figure 7
Figure 7. Bafilomycin A treatment results in accumulation of CCHFV in MVBs and blocks virus replication.
(A) SW13 cells were pretreated with DMSO or bafilomycin A (20 nM) for 1 h. Subsequently, cells were incubated with CCHFV in the presence of the drug for 24 h and then fixed, permeabilized, and stained with anti-N antibody (red), anti-CD63 antibody (green), and CellMask blue dye (grey). Images were obtained as Z-stacks, and 3D images of cells were generated to assess colocalization between N and MVBs. An optical section through the middle of the cell is shown (top and middle panels). The arrowheads indicate examples of CCHFV N-CD63 colocalization (yellow). The percentages of N puncta found in MVBs were counted in 20 cells in each sample, and averages and standard deviations are shown (lower left panel). (B) To determine whether bafilomycin A treatment affected CCHFV replication, SW13 cells were pretreated with DMSO in duplicate or bafilomycin A for 1 h and then inoculated with equal amount of CCHFV in the presence of the drug. After 2 h, one set of DMSO-treated cells was subjected to RNA extraction. RNA isolation from the second set of DMSO-treated cells and bafilomycin A-treated cells took place 24 h after virus addition. Viral RNA levels were determined by a qRT-PCR (TaqMan) assay detecting sequences in S segment of the genome. Two independent experiments were performed in duplicate, and standard deviations were calculated. Representative data are shown. (C) SW13 cells were treated as described in (A), then incubated with gamma-irradiated CCHFV in the presence of the drug for 24 h. Antibody staining and quantification of N-CD63 colocalization were performed as in (A) (right panel).

Similar articles

Cited by

References

    1. Estrada-Pena A, Ruiz-Fons F, Acevedo P, Gortazar C, de la Fuente J (2013) Factors driving the circulation and possible expansion of Crimean-Congo haemorrhagic fever virus in the western Palearctic. J Appl Microbiol 114: 278–286. - PubMed
    1. Whitehouse CA (2004) Crimean-Congo hemorrhagic fever. Antiviral Res 64: 145–160. - PubMed
    1. Ergonul O (2006) Crimean-Congo haemorrhagic fever. Lancet Infect Dis 6: 203–214. - PMC - PubMed
    1. Vorou R, Pierroutsakos IN, Maltezou HC (2007) Crimean-Congo hemorrhagic fever. Curr Opin Infect Dis 20: 495–500. - PubMed
    1. Schmaljohn CS, Nichol S T. (2007) Bunyaviridae. In: Knipe DM, Howley P M., editor. Fields Virology. Philadelphia: Lippincott Williams & Wilkins. pp. 1741–1789.

Publication types

MeSH terms

Substances