

Geometry shapes evolution of early multicellularity
- PMID: 25233196
- PMCID: PMC4168977
- DOI: 10.1371/journal.pcbi.1003803
Geometry shapes evolution of early multicellularity
Abstract
Organisms have increased in complexity through a series of major evolutionary transitions, in which formerly autonomous entities become parts of a novel higher-level entity. One intriguing feature of the higher-level entity after some major transitions is a division of reproductive labor among its lower-level units in which reproduction is the sole responsibility of a subset of units. Although it can have clear benefits once established, it is unknown how such reproductive division of labor originates. We consider a recent evolution experiment on the yeast Saccharomyces cerevisiae as a unique platform to address the issue of reproductive differentiation during an evolutionary transition in individuality. In the experiment, independent yeast lineages evolved a multicellular "snowflake-like" cluster formed in response to gravity selection. Shortly after the evolution of clusters, the yeast evolved higher rates of cell death. While cell death enables clusters to split apart and form new groups, it also reduces their performance in the face of gravity selection. To understand the selective value of increased cell death, we create a mathematical model of the cellular arrangement within snowflake yeast clusters. The model reveals that the mechanism of cell death and the geometry of the snowflake interact in complex, evolutionarily important ways. We find that the organization of snowflake yeast imposes powerful limitations on the available space for new cell growth. By dying more frequently, cells in clusters avoid encountering space limitations, and, paradoxically, reach higher numbers. In addition, selection for particular group sizes can explain the increased rate of apoptosis both in terms of total cell number and total numbers of collectives. Thus, by considering the geometry of a primitive multicellular organism we can gain insight into the initial emergence of reproductive division of labor during an evolutionary transition in individuality.
Conflict of interest statement
The authors have declared that no competing interests exist.
Figures
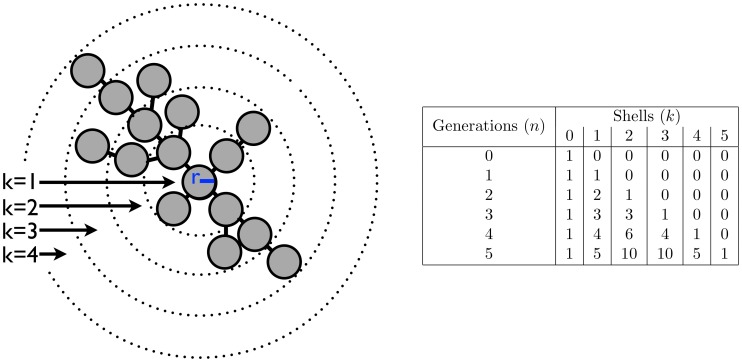
 generations, each shell
  contains
  cells exclusively.
 described by the recursion
  . This can be solved analytically to get
  . B) A model of a growing tree with a degree cap of 4. Similar to A) there is a recursive relationship for the number of nodes in a branch but it delves one more generation into the past, i.e.
  . For both trees the total number of nodes in the tree is twice the number in the red branch.
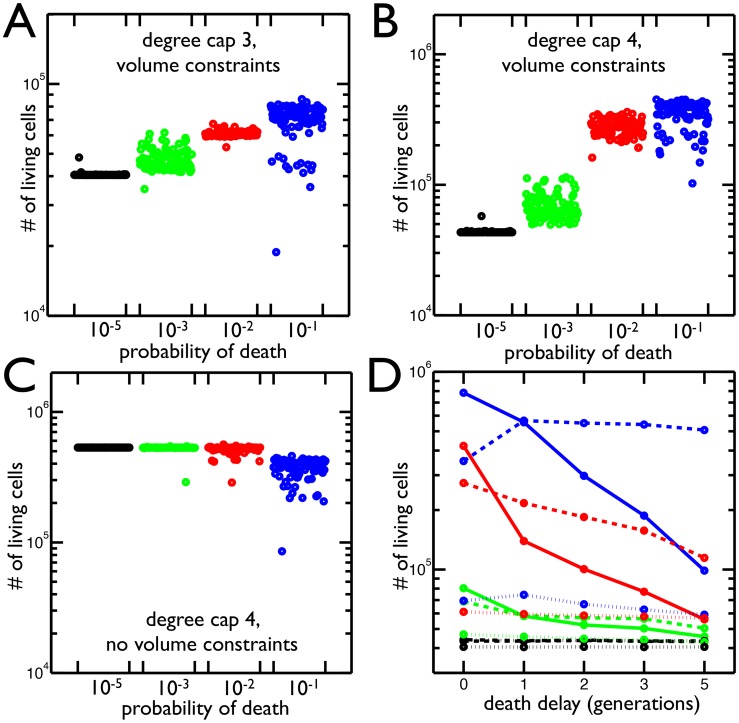
 in blue) has the largest number of cells and the greatest variance in final cell number. B) Same as A but with maximum node degree 4. Once again the highest probability of death (
 in blue) produces the most cells. C) The same as B but the volume constraints are removed, i.e. the maximum node degree is still 4 but there is no limit to the number of cells in each shell. The
  probability of death no longer increases the population of cells. D) The mean number of living cells when a cell's susceptibility to death is delayed by 0–5 generations (
 time units) since it last reproduced. The colors correspond to probabilities of death:
  (blue),
  (red),
  (green),
  (black); and the line style represents the degree cap: no cap (solid), 4 (dashed), 3 (dotted). In trees with degree caps of 3 and 4, the highest probability of death results in even more cells when death is delayed one generation but less as death is delayed further. In all other cases, delaying death results in less cells.
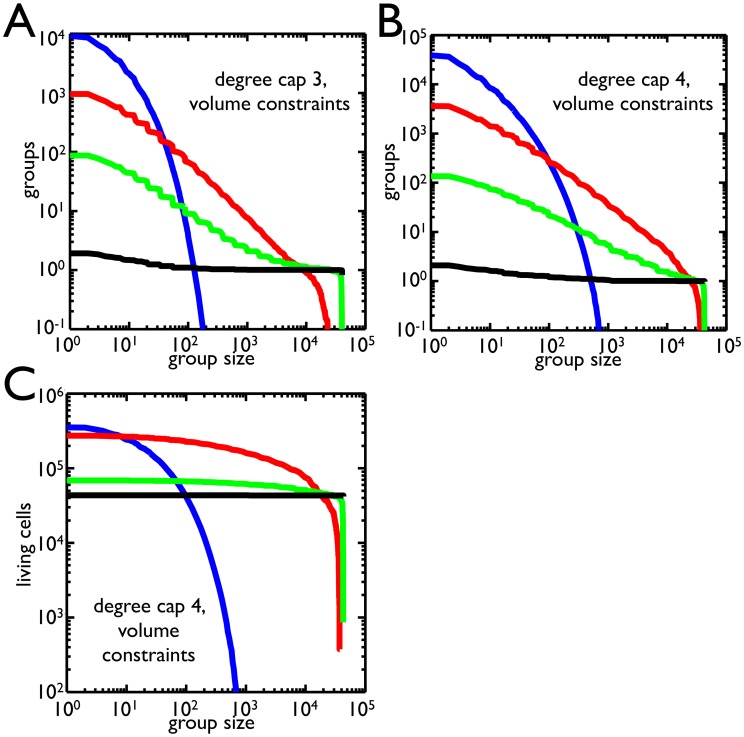
 (blue),
  (red),
  (green),
  (black). As the group size increases, the number of groups above threshold drops. Small group size favors higher probabilities of death while large group size favors low probability of death. B) Same as A but with a degree cap of 4. The range in which
  is dominant has expanded and
  does better at group sizes above
  . C) The number of cells within groups that satisfy size thresholds for a degree cap of 4 is shown for different probabilities of death (same color scheme). In contrast to B, the
  probability of death has a much larger range in which it is best. Comparing B and C, there is a region between 10 and 100 cells in which the
  probability of death produces more groups but fewer cells in those groups than
  .
.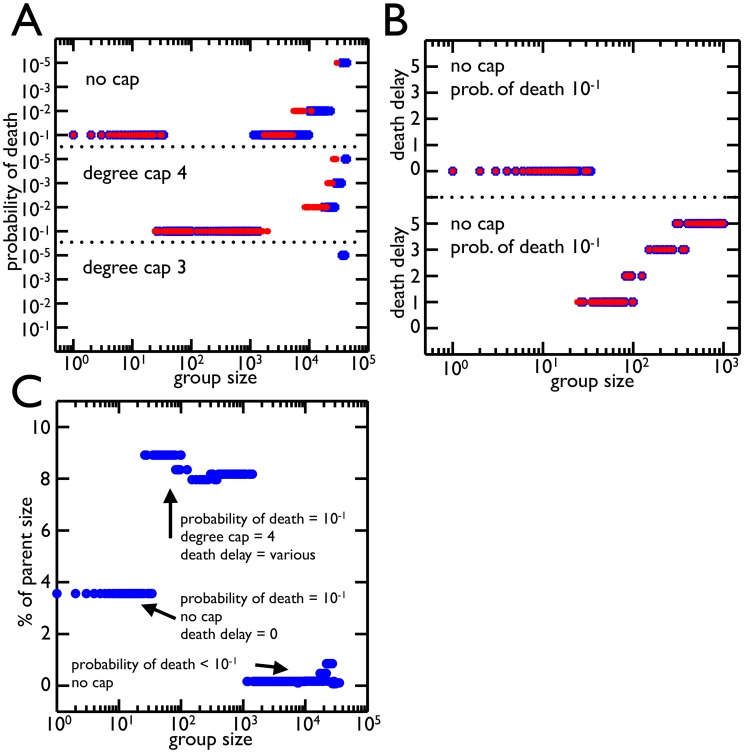
 probability of death for a degree cap of 4 and no cap is the best strategy for most group sizes. Once the group size gets large (
 ) lower probabilities of death begin to win as it is advantageous not to divide large groups. B) The best strategies from A for group size thresholds ¡
  are distinguished by death delay (number of rounds without reproduction before a cell is susceptible to death). The optimal strategy of
  for no cap has no death delay, i.e. all cells are susceptible to death. For group size thresholds around
  where degree cap of 4 with probability of death
  does better, the death delay increases with group size threshold. This increased death delay effectively lowers the probability of death. C) The average size of group offspring as a percent of parent size is shown for each optimal strategy from A (death delays included). The values are all under
  and are much smaller than those experimentally observed. There was, however, only one strategy which left more symmetrical groups (a degree cap of 3 with the highest probability of death).
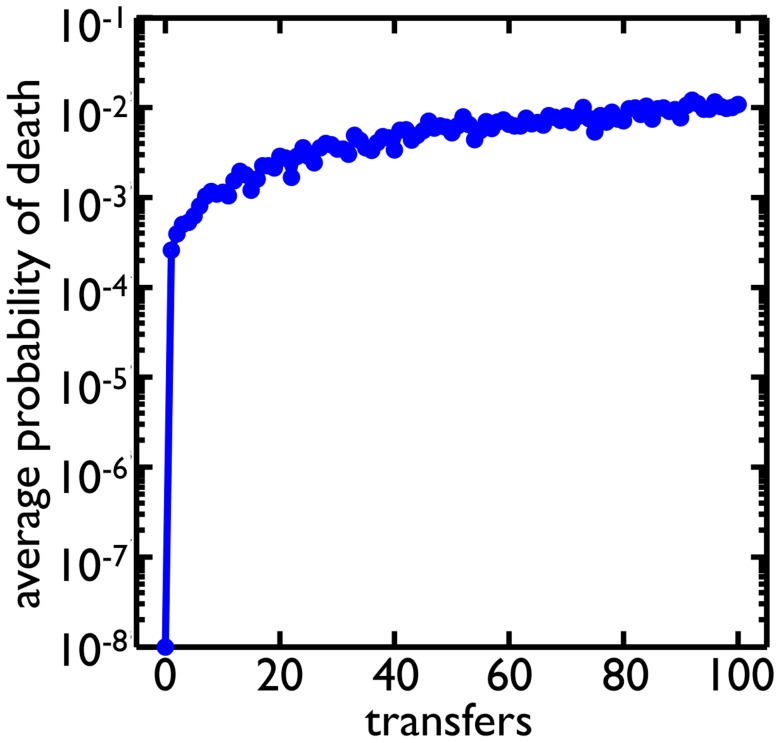
 cells, and selective phases, in which clusters are randomly chosen based on size (see Methods) similar to the experimental regime. Cells can mutate and change their probability of death. Starting from a probability of death of
  , the average probability of death in the population evolves to around
  .
.References
-
- Maynard Smith J, Szathmáry E (1997) The Major Transitions in Evolution. Oxford University Press, USA.
-
- Calcott B, Sterelny K, Szathmry E (2011) The Major Transitions in Evolution Revisited. Cambridge, MA: MIT Press.
-
- Okasha S (2005) Multilevel selection and the major transitions in evolution. Philosophy of science 72: 1013–1025 10.1086/508102 - DOI
-
- Bonner JT (1998) The origins of multicellularity. Integrative Biology 1: 27–36 10.1146/annurev.genet.42.110807.091513 - DOI
-
- Michod RE (1997) Cooperation and conflict in the evolution of individuality. I. Multilevel selection of the organism. Am. Nat 49: 607–645.
Publication types
MeSH terms
LinkOut - more resources
Full Text Sources
Other Literature Sources
Molecular Biology Databases
