. 2014 Sep 18;10(9):e1004393.
doi: 10.1371/journal.ppat.1004393. eCollection 2014 Sep.

The CD14+CD16+ inflammatory monocyte subset displays increased mitochondrial activity and effector function during acute Plasmodium vivax malaria

Affiliations

The CD14+CD16+ inflammatory monocyte subset displays increased mitochondrial activity and effector function during acute Plasmodium vivax malaria

Lis R V Antonelli et al. PLoS Pathog. .

Abstract

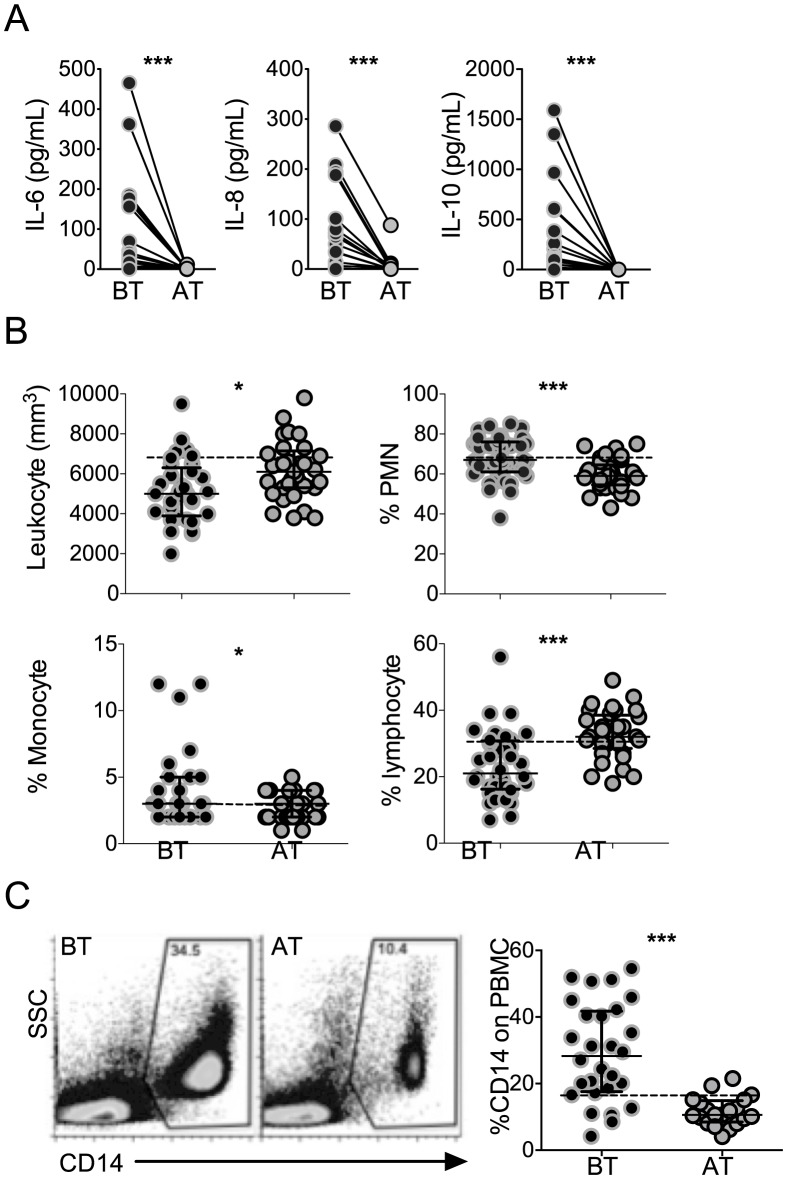
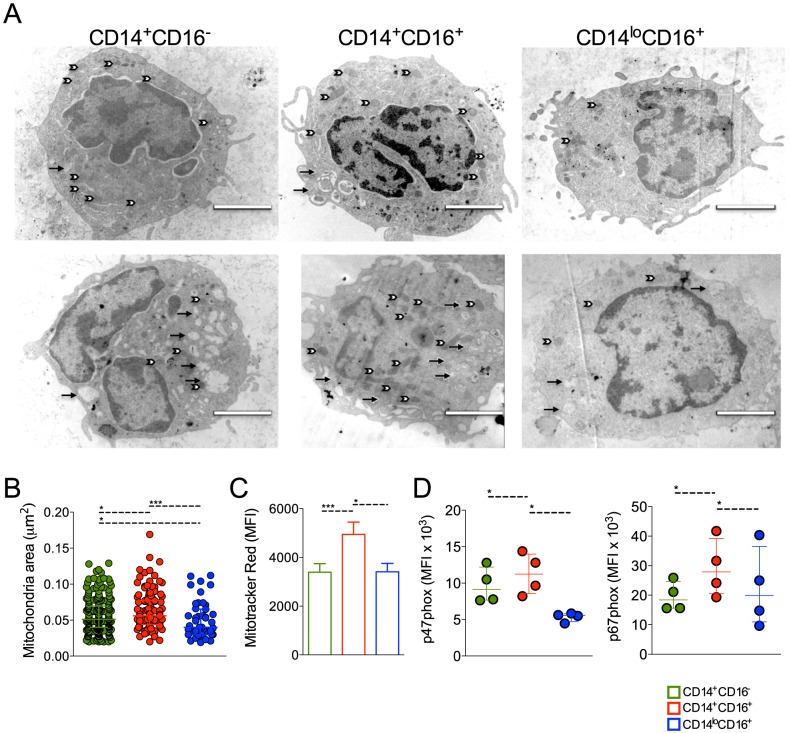
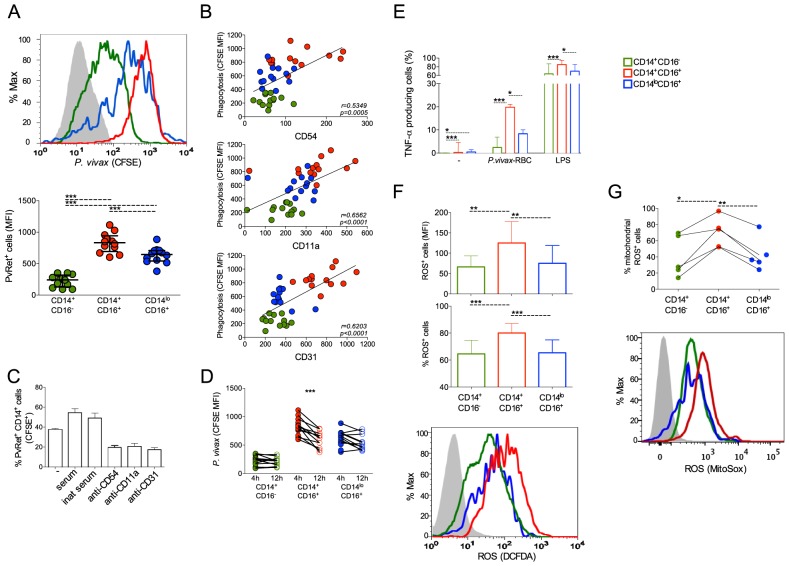
Infection with Plasmodium vivax results in strong activation of monocytes, which are important components of both the systemic inflammatory response and parasite control. The overall goal of this study was to define the role of monocytes during P. vivax malaria. Here, we demonstrate that P. vivax-infected patients display significant increase in circulating monocytes, which were defined as CD14(+)CD16- (classical), CD14(+)CD16(+) (inflammatory), and CD14loCD16(+) (patrolling) cells. While the classical and inflammatory monocytes were found to be the primary source of pro-inflammatory cytokines, the CD16(+) cells, in particular the CD14(+)CD16(+) monocytes, expressed the highest levels of activation markers, which included chemokine receptors and adhesion molecules. Morphologically, CD14(+) were distinguished from CD14lo monocytes by displaying larger and more active mitochondria. CD14(+)CD16(+) monocytes were more efficient in phagocytizing P. vivax-infected reticulocytes, which induced them to produce high levels of intracellular TNF-α and reactive oxygen species. Importantly, antibodies specific for ICAM-1, PECAM-1 or LFA-1 efficiently blocked the phagocytosis of infected reticulocytes by monocytes. Hence, our results provide key information on the mechanism by which CD14(+)CD16(+) cells control parasite burden, supporting the hypothesis that they play a role in resistance to P. vivax infection.


Conflict of interest statement

The authors have declared that no competing interests exist.

Figures

Figure 1
Figure 1. P. vivax-infected patients display higher levels of cytokines accompanied by increased frequencies of circulating monocytes.
(A) IL-6, IL-8 and IL-10 were measured in plasma of P. vivax-infected individuals before (BT, black circles) and 30–45 days after (AT, grey circles) treatment (n = 20). Levels of cytokine were measured by Cytometric Bead Array. (B) Leukocyte counts and frequencies from P. vivax-infected individuals before (BT, black circles) and after (AT, grey circles) treatment were assessed at a clinical laboratory (n = 33). C) Representative density plots of CD14+ monocytes (left panel) and frequencies of CD14+ monocytes (right panel) within PBMCs from P. vivax-infected individuals (BT, n = 28 and AT, n = 20). Circles indicate individual patients and lines represent median values and interquartile ranges. Dotted lines represent medians of a given measurements from healthy donors. *p<0.05, ***p<0.01.
Figure 2
Figure 2. P. vivax infection alters the expression of activation markers, adhesion molecules and chemokine receptors on circulating monocytes.
Mean fluorescence intensity (MFI) of HLA-DR (BT, n = 24 and AT, n = 19), CD31 (BT, n = 25 and AT, n = 20), CCR7 (BT, n = 28 and AT, n = 19) (left panels, from the top to the bottom), CD54 (BT, n = 25 and AT, n = 19), CD106 (BT, n = 28 and AT, n = 19), CX3CR1 (BT, n = 28 and AT, n = 20) (right panels, from the top to the bottom) was evaluated on monocytes from P. vivax-infected subjects, before (BT, black circles) and 30–45 days after treatment (AT, grey circles). Circles indicate individual patients and lines represent median values and interquartile ranges. Dotted lines represent medians of a given measurements from healthy donors. Levels of the molecules above were measured by flow cytometry. **0.05>p>0.01, *** p<0.01.
Figure 3
Figure 3. Characterization of monocyte subsets in malaria patients.
(A) Representative dot plots showing the gate strategy for the identification of CD14+CD16 (green gate), CD14+CD16+ (red gate), CD14loCD16+ (blue gate) monocyte subsets. CD14+CD16, CD14+CD16+ and CD14loCD16+ monocytes are represented by green, red and blue symbols. (B) Frequencies of CD14+CD16, CD14+CD16+ and CD14lo monocytes within PBMC from P. vivax-infected patients before (BT, filled symbols) and 30–45 days after treatment (AT, open symbols) (n = 28). (C) Mean fluorescence intensity (MFI) of CCR2 (BT, n = 28 and AT, n = 18), CX3CR1 (BT, n = 26 and AT, n = 19), CCR7 (BT, n = 28 and AT, n = 19) and LFA-1 (BT, n = 15 and AT, n = 11) (from the top to the bottom) was evaluated on monocyte subsets (CD14+CD16 (left panel), CD14+CD16+ (middle panel), CD14loCD16+ (right panel)) from P. vivax-infected subjects, before and 30–45 days after treatment. Dotted lines represent medians of a given measurements from healthy donors. (D) Scattered dot plots (left panels) and representative histograms (right panels) showing MFI of the molecules described above on CD14+CD16, CD14+CD16+ and CD14loCD16+ monocytes from P. vivax-infected patients before treatment (open histograms). Levels of the molecules above were measured by flow cytometry. Circles indicate individual patients and lines represent median values and interquartile ranges. (E) Levels of molecules expressed by the monocyte subsets analyzed according to D. * p<0.05, **0.05>p>0.01, ***p<0.01.
Figure 4
Figure 4. Monocyte subsets display distinct gene expression.
CD14+CD16, CD14+CD16+ and CD14loCD16+ monocytes from healthy donors and P. vivax-infected patients were isolated by FACS. (A) Representative dot plots showing monocyte subpopulations before (left panel) and after FACS-sorting (right panels). (B) A nanostring analysis of monocyte subsets from 5 patients infected with P. vivax and 5 healthy donors. Heatmap representation of 41 differentially regulated genes upon malaria infection compared to healthy donors is depicted. (C) CCL2, CXCL2, ICAM1, NLRP3, TNFR1/TNFRSF1A, NFKB1, REL, NFKB1A, IFNGR2, IL1RA, IL8, CASP1, CR1, CD80, IL10, IL6 and TNF were differentially induced among CD14+CD16 (green bars), CD14+CD16+ (red bars) and CD14loCD16+ (blue bars) monocytes from P. vivax-infected patients. *p<0.05, **0.05>p>0.01, ***p<0.01.
Figure 5
Figure 5. Circulating monocyte subpopulations display distinct morphology, mitochondrial and NADPH subunit content.
FACS-sorted CD14+CD16, CD14+CD16+ and CD14loCD16+ monocytes from healthy donors and P. vivax-infected patients were fixed and prepared for electron microscopy. Monocyte subsets from a single healthy donor (A, upper panel) and a single patient (A, lower panel) shown are representative of the analysis of at least six cells of each monocyte subpopulation per patient and of the analysis of 5 controls and 6 patients. Mitochondria (white arrows) and vesicles (black arrows). Scale bar, 2 µm. (B) Mitochondria area from CD14+CD16 (green circles), CD14+CD16+ (red circles) and CD14loCD16+ (blue circles) monocytes was assessed using ImageJ. Circles indicate individual mitochondria. (C) Mitochondria content in CD14+CD16 (green bars), CD14+CD16+ (red bars) and CD14loCD16+ (blue bars) monocytes from P. vivax-infected patients was measured based on Mitotracker reactivity (n = 11). (D) Mean fluorescence intensity (MFI) of p47phox and p67phox within CD14+CD16, CD14+CD16+, CD14loCD16+ monocytes from P. vivax-infected patients was measured by flow cytometry 3 hours after culture in medium alone or P. vivax-infected reticulocytes (n = 4). Results are representative of 2 independent experiments. Symbols represent individual subject. *p<0.05, ***p<0.01.
Figure 6
Figure 6. Monocyte subsets from P. vivax-infected patients display a highly activated phenotype.
CD14+CD16, CD14+CD16+ and CD14loCD16+ monocytes are represented by green, red and blue symbols. (A) Mean fluorescence intensity (MFI) of HLA-DR (BT, n = 11 and AT, n = 11), CD106 (BT, n = 26 and AT, n = 19), CD54 (BT, n = 28 and AT, n = 19) and CD31 (BT, n = 25 and AT, n = 20) (from the top to the bottom) was evaluated on monocyte subsets (CD14+CD16 (left panel), CD14+CD16+ (middle panel), CD14loCD16+ (right panel)) from P. vivax-infected subjects, before (filled symbols) and 30–45 days after treatment (open symbols). Dotted lines represent medians of given measurements from healthy donors. (B) Scattered dot plots (left panels) and representative histograms (right panels) showing MFI of the molecules described above on CD14+CD16, CD14+CD16+ and CD14loCD16+ monocytes from P. vivax-infected patients before treatment. Levels of the molecules above were measured by flow cytometry. Circles indicate individual patients and lines represent median values and interquartile ranges. (C) Levels of molecules expressed by the monocyte subsets analyzed according to B. *p<0.05, **0.05>p>0.01, ***p<0.01.
Figure 7
Figure 7. CD16+CD14+ monocytes display pronounced phagocytic ability than other subsets.
CD14+CD16, CD14+CD16+ and CD14loCD16+ monocytes are represented by green, red, and blue symbols, respectively. P. vivax-infected reticulocytes (Pv-Ret) were purified, CFSE labeled (A, B, C) or not (D, E) and cultured with PBMC from acutely P. vivax-infected subjects. (A) Mean fluorescence intensity (MFI) of CFSE within CD14+CD16, CD14+CD16+, CD14loCD16+ monocytes exposed to P. vivax was measured by flow cytometry after 4 hours of culture. Each circle represents a single patient (n = 12) and lines represent median values and interquartile ranges (B) Correlation between P. vivax phagocytosis (CFSE MFI) and CD54, CD11a or CD31 expression by CD14+CD16, CD14+CD16+, CD14loCD16+ monocytes. Circles indicate individual patients (n = 13). (C) Phagocytosis of Pv-Ret by CD14+ cells was measured in the absence of serum, presence of inactivated serum and presence of serum, and in the presence of anti-CD54, CD11a and CD31 blocking antibodies (lower graph). Bars represent median values and interquartile ranges (n = 6). (D) MFI of CFSE within CD14+CD16, CD14+CD16+, CD14loCD16+ monocytes exposed to P. vivax was measured by flow cytometry after 4 and 12 hours of culture. Connecting circles represent values of CFSE MFI of a single patient after 4 and 12 hours of culture, (n = 12) (E) Frequencies of TNF-α producing monocyte subsets were measured after culture with medium alone, Pv-Ret or LPS. Bars represent median values and interquartile ranges (n = 6). (F) ROS production was detected by measuring MFI (top panel) and the proportions (middle panel) of carboxy-H2DCDA+ CD14+CD16, CD14+CD16+ and CD14loCD16+ monocytes after 3 hours incubation with P. vivax-infected reticulocytes. Bars represent median values and interquartile ranges (n = 9). Representative histograms showing MFI of carboxy-H2DCFDA expressing CD14+CD16, CD14+CD16+, CD14loCD16+ monocytes (bottom panel). Grey histogram represents CD14+ cells cultured in the absence of Pv-Ret. (G) Mitochondrial ROS was assessed in monocyte subsets from P. vivax-infected patients measuring MitoSox by flow cytomery after culture with P. vivax-infected reticulocytes (n = 4). Connecting circles represent frequencies of different monocyte subsets producing mitochondrial ROS. Symbols represent individual subject. Representative histograms showing MFI of MitoSox expressing CD14+CD16, CD14+CD16+, CD14loCD16+ monocytes (bottom panel). Grey histogram represents MitoSox- cells. *p<0.05, **0.05>p>0.01, ***p<0.01.

References

    1. Gething PW, Elyazar IR, Moyes CL, Smith DL, Battle KE, et al. (2012) A long neglected world malaria map: Plasmodium vivax endemicity in 2010. PLoS Negl Trop Dis 6: e1814. - PMC - PubMed
    1. Langhorne J, Ndungu FM, Sponaas AM, Marsh K (2008) Immunity to malaria: more questions than answers. Nat Immunol 9: 725–732. - PubMed
    1. Spence PJ, Langhorne J (2012) T cell control of malaria pathogenesis. Curr Opin Immunol 24: 444–448. - PubMed
    1. Mueller I, Galinski MR, Baird JK, Carlton JM, Kochar DK, et al. (2009) Key gaps in the knowledge of Plasmodium vivax, a neglected human malaria parasite. Lancet Infect Dis 9: 555–566. - PubMed
    1. Leoratti FM, Trevelin SC, Cunha FQ, Rocha BC, Costa PA, et al. (2012) Neutrophil paralysis in Plasmodium vivax malaria. PLoS Negl Trop Dis 6: e1710. - PMC - PubMed

Publication types

MeSH terms