

The circuit architecture of whole brains at the mesoscopic scale
- PMID: 25233311
- PMCID: PMC4256953
- DOI: 10.1016/j.neuron.2014.08.055
The circuit architecture of whole brains at the mesoscopic scale
Abstract
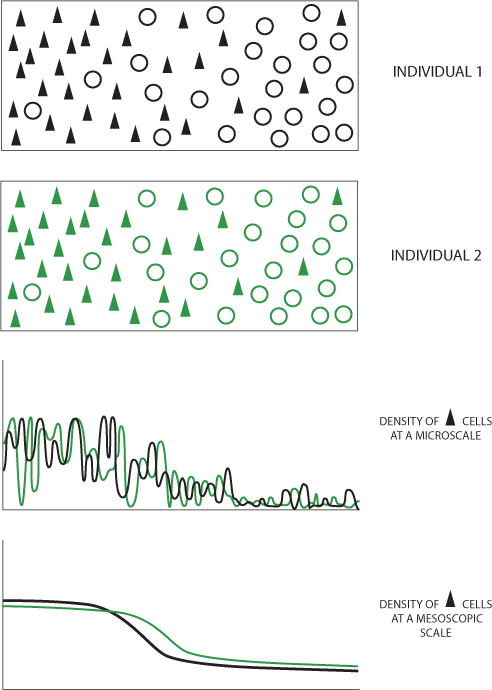
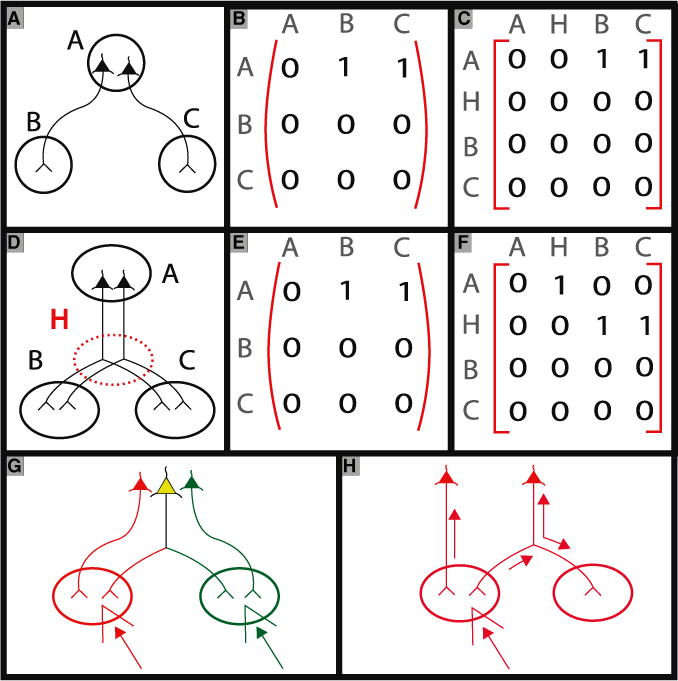
Vertebrate brains of even moderate size are composed of astronomically large numbers of neurons and show a great degree of individual variability at the microscopic scale. This variation is presumably the result of phenotypic plasticity and individual experience. At a larger scale, however, relatively stable species-typical spatial patterns are observed in neuronal architecture, e.g., the spatial distributions of somata and axonal projection patterns, probably the result of a genetically encoded developmental program. The mesoscopic scale of analysis of brain architecture is the transitional point between a microscopic scale where individual variation is prominent and the macroscopic level where a stable, species-typical neural architecture is observed. The empirical existence of this scale, implicit in neuroanatomical atlases, combined with advances in computational resources, makes studying the circuit architecture of entire brains a practical task. A methodology has previously been proposed that employs a shotgun-like grid-based approach to systematically cover entire brain volumes with injections of neuronal tracers. This methodology is being employed to obtain mesoscale circuit maps in mouse and should be applicable to other vertebrate taxa. The resulting large data sets raise issues of data representation, analysis, and interpretation, which must be resolved. Even for data representation the challenges are nontrivial: the conventional approach using regional connectivity matrices fails to capture the collateral branching patterns of projection neurons. Future success of this promising research enterprise depends on the integration of previous neuroanatomical knowledge, partly through the development of suitable computational tools that encapsulate such expertise.
Copyright © 2014 Elsevier Inc. All rights reserved.
Figures
References
-
- Ade PA, Aikin RW, Barkats D, Benton SJ, Bischoff CA, Bock JJ, Brevik JA, Buder I, Bullock E, Dowell CD, et al. Detection of B-mode polarization at degree angular scales by BICEP2. Phys Rev Lett. 2014;112:241101. - PubMed
-
- Albert R, Jeong H, Barabasi AL. Error and attack tolerance of complex networks. Nature. 2000;406:378–382. http://dx.doi.org/10.1038/35019019. - DOI - PubMed
-
- Alivisatos AP, Chun M, Church GM, Greenspan RJ, Roukes ML, Yuste R. The brain activity map project and the challenge of functional connectomics. Neuron. 2012;74:970–974. http://dx.doi.org/10.1016/j.neuron.2012.06.006. - DOI - PMC - PubMed
-
- Anderson PW. More is different. Science. 1972;177:393–396. - PubMed
-
- Bennett MR, Hacker PMS. Philosophical Foundations of Neuroscience. Malden: Blackwell; 2003.
Publication types
MeSH terms
Grants and funding
LinkOut - more resources
Full Text Sources
Other Literature Sources
