Review
. 2014 Sep 17;83(6):1329-34.
doi: 10.1016/j.neuron.2014.08.040.

Toward functional classification of neuronal types

Affiliations
Review

Toward functional classification of neuronal types

Tatyana O Sharpee. Neuron. .

Abstract

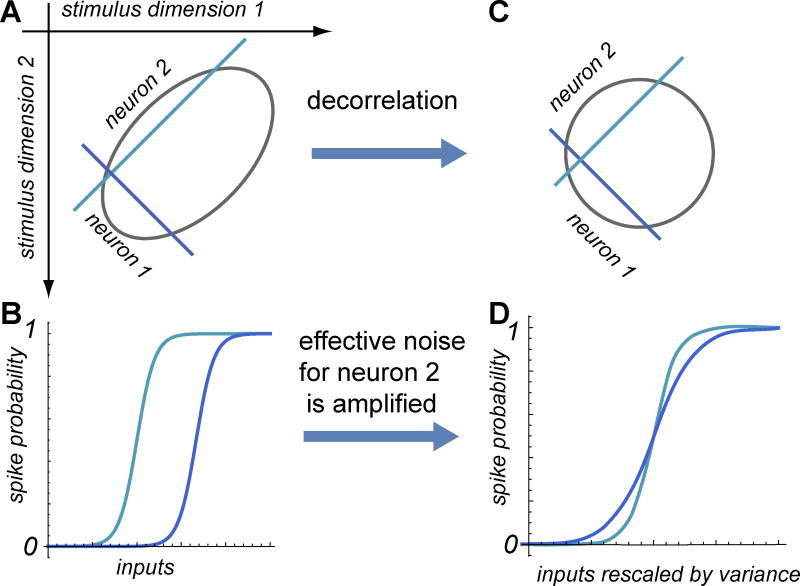
How many types of neurons are there in the brain? This basic neuroscience question remains unsettled despite many decades of research. Classification schemes have been proposed based on anatomical, electrophysiological, or molecular properties. However, different schemes do not always agree with each other. This raises the question of whether one can classify neurons based on their function directly. For example, among sensory neurons, can a classification scheme be devised that is based on their role in encoding sensory stimuli? Here, theoretical arguments are outlined for how this can be achieved using information theory by looking at optimal numbers of cell types and paying attention to two key properties: correlations between inputs and noise in neural responses. This theoretical framework could help to map the hierarchical tree relating different neuronal classes within and across species.


Figures

Figure 1
Figure 1. Decorrelation amplifies the effect of noise in neural coding
(A) One of the possible optimal configurations of neural thresholds in the presence of correlations. Neuron 1 encodes the input value along the direction of largest variance, whereas neuron 2 encodes the input value along the other dimension. (B) The thresholds values of the two neurons are proportional to the input variances along their respective relevant dimensions. (C and D) are equivalent to (A) and (B) except that the input scales are rescaled by their respective variances. This representation emphasizes that decorrelation increases the effective noise for neuron 2.
Figure 2
Figure 2. Separate classes of neurons encoding the same input dimension can appear with decreasing neural noise
The noise values measured relative to the input standard deviation are ν=0.1, 0.3, 0.5, top to bottom row. The probability of a spike from a neuron with a threshold μ and noise value ν is modeled using logistic function P(spikex)=11+exp(x-μν), with x is a Gaussian input of unit variance. For two neurons, there are four different patterns (00, 01, 10, 11 where each neuron is assigned response 0 or 1 if it produces a spike). Neurons are assumed to be conditionally independent given x. With these assumptions, it is possible to evaluate mutual information as the difference between response entropy R = −p00log2p00p01log2p01p10log2p10p11log2p11 and noise entropy N=dx11+exp(μ1-xν)log2[1+exp(μ1-xν)]+dx11+exp(x-μ1ν)log2[1+exp(x-μ1ν)]+dx11+exp(μ2-xν)log2[1+exp(μ2-xν)]+dx11+exp(x-μ2ν)log2[1+exp(x-μ2ν)], where μ1 and μ2 are the thresholds for the neurons 1 and 2, respectively. The mutual information I=R-N is plotted here as a function of the difference between thresholds μ1μ2. For each value of μ1μ2 and ν, the average threshold between the two neurons is adjusted to ensure that the spike rate remains constant for all information values shown. In these simulation, the average spike rate across all inputs x and summed for neurons 1 and 2 was set to 0.2. In this case, transition from redundant coding observed for large noise values to coding based on different thresholds (observed at low noise values) occurs at ν ~ 0.4.
Figure 3
Figure 3. Cross-over between different encoding schemes
In scheme 1, neuron classes are defined based on different input. The mutual information depends on both correlation between inputs and the neural noise level. In scheme 2, neuron classes are defined based on differences in thresholds for the same input feature. The mutual information is independent of stimulus correlations and is shown here with lines parallel to the x-axis. Color denotes the noise level relative to the standard deviation along the dimension of largest variance. All simulations have been matched to have the same average spike rate across inputs (values are as in Figure 2). Suboptimal solutions (after the cross-over) are shown using dashed and dotted lines, respectively for the case of parallel and orthogonal solutions.

References

    1. Adelman TL, Bialek W, Olberg RM. The information content of receptive fields. Neuron. 2003;40:823–833. - PubMed
    1. Ala-Laurila P, Greschner M, Chichilnisky EJ, Rieke F. Cone photoreceptor contributions to noise and correlations in the retinal output. Nat Neurosci. 2011;14:1309–1316. - PMC - PubMed
    1. Aljadeff J, Segev R, Berry MJ, 2nd, Sharpee TO. Spike triggered covariance in strongly correlated gaussian stimuli. PLoS Comput Biol. 2013;9:e1003206. - PMC - PubMed
    1. Atick JJ, Li Z, Redlich AN. Understanding retinal color coding from first principles. Neural Comput. 1992;4:559–572.
    1. Atick JJ, Redlich AN. Towards a theory of early visual processing. Neural Comput. 1990;2:308–320.

Publication types

LinkOut - more resources