. 2014 Sep 18:5:4925.
doi: 10.1038/ncomms5925.

An optimized optogenetic clustering tool for probing protein interaction and function

Affiliations

An optimized optogenetic clustering tool for probing protein interaction and function

Amir Taslimi et al. Nat Commun. .

Abstract

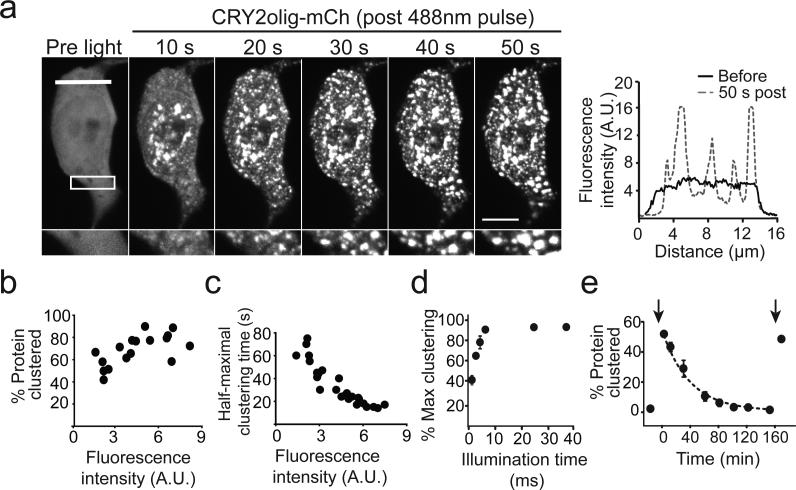
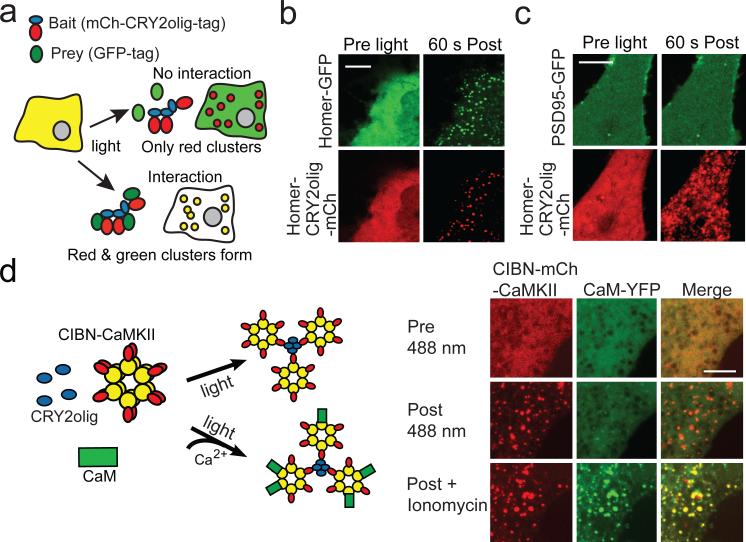
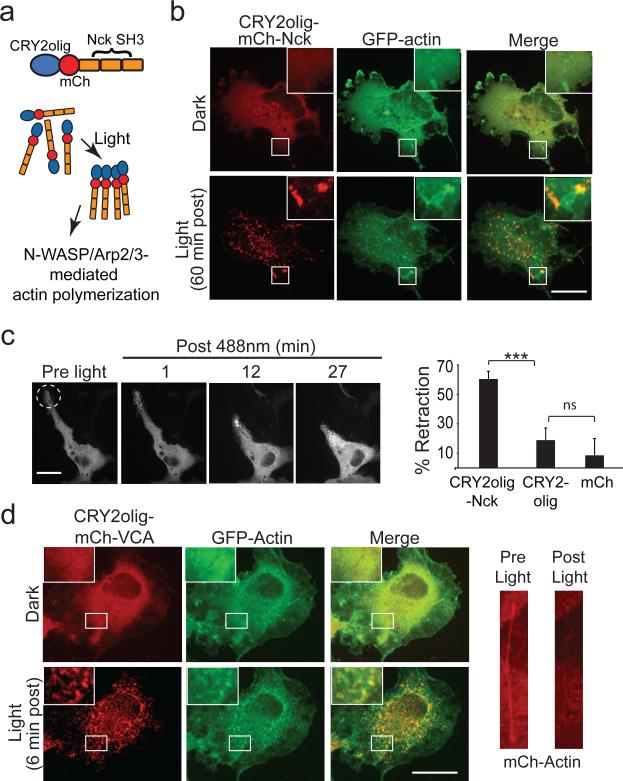
The Arabidopsis photoreceptor cryptochrome 2 (CRY2) was previously used as an optogenetic module, allowing spatiotemporal control of cellular processes with light. Here we report the development of a new CRY2-derived optogenetic module, 'CRY2olig', which induces rapid, robust, and reversible protein oligomerization in response to light. Using this module, we developed a novel protein interaction assay, Light-Induced Co-clustering, that can be used to interrogate protein interaction dynamics in live cells. In addition to use probing protein interactions, CRY2olig can also be used to induce and reversibly control diverse cellular processes with spatial and temporal resolution. Here we demonstrate disrupting clathrin-mediated endocytosis and promoting Arp2/3-mediated actin polymerization with light. These new CRY2-based approaches expand the growing arsenal of optogenetic strategies to probe cellular function.


Figures

Fig. 1
Fig. 1. CRY2olig undergoes rapid clustering with light
(a) HEK293 cells expressing CRY2olig-mCh pre and post blue light (25 ms pulse, 488 nm, 5% laser power). Graph at right shows the relative fluorescence intensity under the line in light vs dark. Scale bar, 7.5 μm. (b) Percentage of cytosolic CRY2olig-mCh depleted into clusters after light (25 ms pulse, 488 nm), correlated with mCh expression level (A.U., arbitrary units). (c) Graph showing dependency of half-maximal clustering time of CRY2olig-mCh on cellular expression level. (d) Light dose dependence. HEK293 cells expressing CRY2olig-mCh were exposed to 2.5 – 40 ms pulses of blue light (5% laser power), allowed to cluster, then illuminated with a saturating light pulse to induce maximal clustering. (e) Clustering recovery quantification. HEK293 cells expressing CRY2olig-mCh were exposed to light at time t=0 (first arrow), followed by a dark incubation for indicated times in the presence of 35 μg/ml cycloheximide. A second pulse of light applied after recovery at 160 min (second arrow) induced re-clustering.
Fig. 2
Fig. 2. LINC co-clustering assay to detect protein interactions
(a) Schematic describing LINC. (b) Positive control. COS-7 cells expressing homer1c-GFP co-cluster with homer1c-CRY2olig-mCh with blue light (50 ms pulse, 488 nm). Scale bar, 7.5 μm. (c) Negative control. PSD95-GFP does not co-cluster with homer1c-CRY2olig-mCh. Scale bar, 7.5 μm. (d) Assessment of dynamic interactions between CaMKII and CaM in response to Ca2+. COS-7 cells expressing CIBN-mCh-CaMKII, CRY2olig, and CaM-YFP were imaged pre and post blue light exposure (500 ms pulse, 488 nm). At resting Ca2+, only a small amount of CaMYFP colocalizes with CaMKII clusters. Addition of ionomycin elevates intracellular Ca2+, resulting in increased CaM-YFP localized to clusters. Scale bar, 5 μm.
Fig. 3
Fig. 3. LINC-FRAP assay
(a) Schematic describing use of LINC-FRAP in synapses. Mobility of a CRY2olig-fused protein (blue) is restricted after light-induced clustering, which restricts the mobility of an interacting FP-tagged protein (red). (b) LINC-FRAP control experiments in primary neuronal cultures showing exchange of CRY2olig-mCh-homer1c is delayed at the indicated photobleached synapse (arrowhead) after blue light clustering. (c) LINC-FRAP quantification before and after blue light, testing homer/PSD95 and homer/homer interactions at synapses.
Fig 4
Fig 4. Light-mediated disruption of clathrin dependent endocytosis
(a) Schematic indicating light-mediated disruption of CLC function. (b) COS-7 cells expressing CRY2oligmCh-CLC before and after blue light. Scale bar, 7.5 μm. (c) COS-7 cell expressing CRY2oligmCh-CLC (inside dashed line) after exposure to blue light is defective for uptake for Alexa 488-transferrin (green), while surrounding untransfected cells show efficient uptake. Scale bar, 7.5 μm (d) Quantification of transferrin uptake in untransfected (mock) vs CRY2olig-CLC expressing cells exposed to dark, blue light, or light/3 hrs dark. Data represents average and S.E.M., n=15. ** p < 0.01 (e) Quantification of clathrin-coated pit dynamics within cells expressing CRY2olig-mCh-CLC in dark or after blue light (200 ms pulse, 488 nm), compared with a DsRed-CLC control. Data represents average and S.E.M., n=3 cells (over 30 clusters/cell counted). **, p < 0.01 (f) TIRF images of COS-7 cells expressing CRY2olig-mCh-CLC, showing clathrin pits at the cell surface before and after blue light exposure (488 nm, 350 ms). Arrow indicates mobile clathrin pit undergoing endocytosis. (g) Kymograph of CRY2olig-mCh-CLC-labeled clathrin pit showing increase in fluorescence after light exposure.
Fig 5
Fig 5. Induction of actin cytoskeletal changes using CRY2olig
(a) Strategy for clustering Nck SH3 domains. (b) Cells expressing CRY2olig-mCh-Nck and GFP-actin in dark, or 60 min post blue light (500 ms pulse, 488nm, every 3 min). Scale bar, 20 μm. (c) Local photostimulation (within circle) of COS-7 cell expressing CRY2olig-mCh-Nck results in retraction of cell extension. Graph at right shows quantification of retraction (average and S.E.M., n = 16) in cells expressing CRY2olig-mCh-Nck, or controls CRY2olig-mCh or mCherryN1 45 min post initial light exposure. ***, p<0.001. ns, not significant (d) Cells expressing CRY2olig-mCh-VCA, CRY2olig, and GFP-actin in dark or 6 min post blue light (500 ms pulse, 488 nm, every 3 min). Inset images at right show detail within white square. Scale bar, 20 μm. (e) Stress fibers within cells expressing CRY2olig-GFP-VCA, CRY2olig, and mCherry-actin are disrupted with light exposure.

Comment in

References

    1. Fields S, Song O. A novel genetic system to detect protein-protein interactions. Nature. 1989;340:245–246. - PubMed
    1. Lowder MA, Appelbaum JS, Hobert EM, Schepartz A. Visualizing protein partnerships in living cells and organisms. Curr. Opin. Chem. Biol. 2011;15:781–788. - PMC - PubMed
    1. Petschnigg J, Snider J, Stagljar I. Interactive proteomics research technologies: recent applications and advances. Curr. Opin. Biotechnol. 2011;22:50–58. - PubMed
    1. Banaszynski LA, Chen L, Maynard-Smith LA, Ooi AGL, Wandless TJ. A Rapid, Reversible, and Tunable Method to Regulate Protein Function in Living Cells Using Synthetic Small Molecules. Cell. 2006;126:995–1004. - PMC - PubMed
    1. Buskirk AR, Liu DR. Creating Small-Molecule-Dependent Switches to Modulate Biological Functions. Chem. Biol. 2005;12:151–161. - PubMed

Publication types