

Genome-wide meta-analysis of myopia and hyperopia provides evidence for replication of 11 loci
- PMID: 25233373
- PMCID: PMC4169415
- DOI: 10.1371/journal.pone.0107110
Genome-wide meta-analysis of myopia and hyperopia provides evidence for replication of 11 loci
Abstract
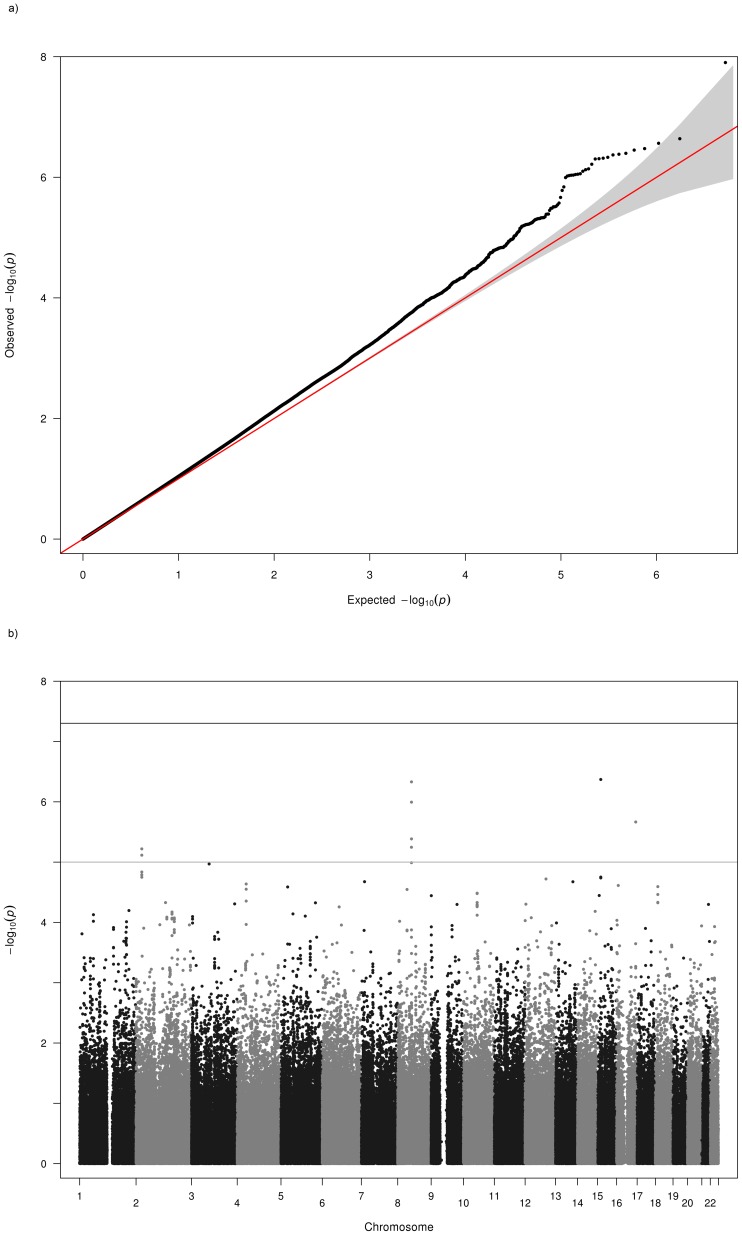
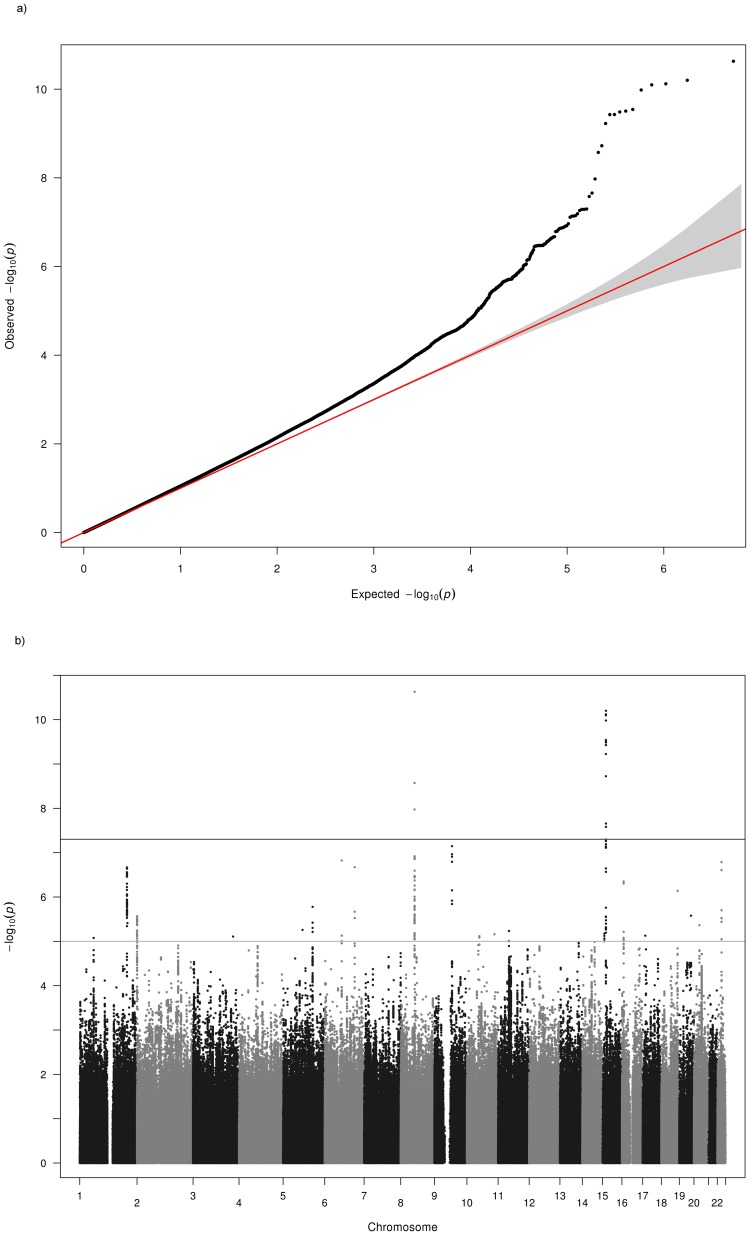
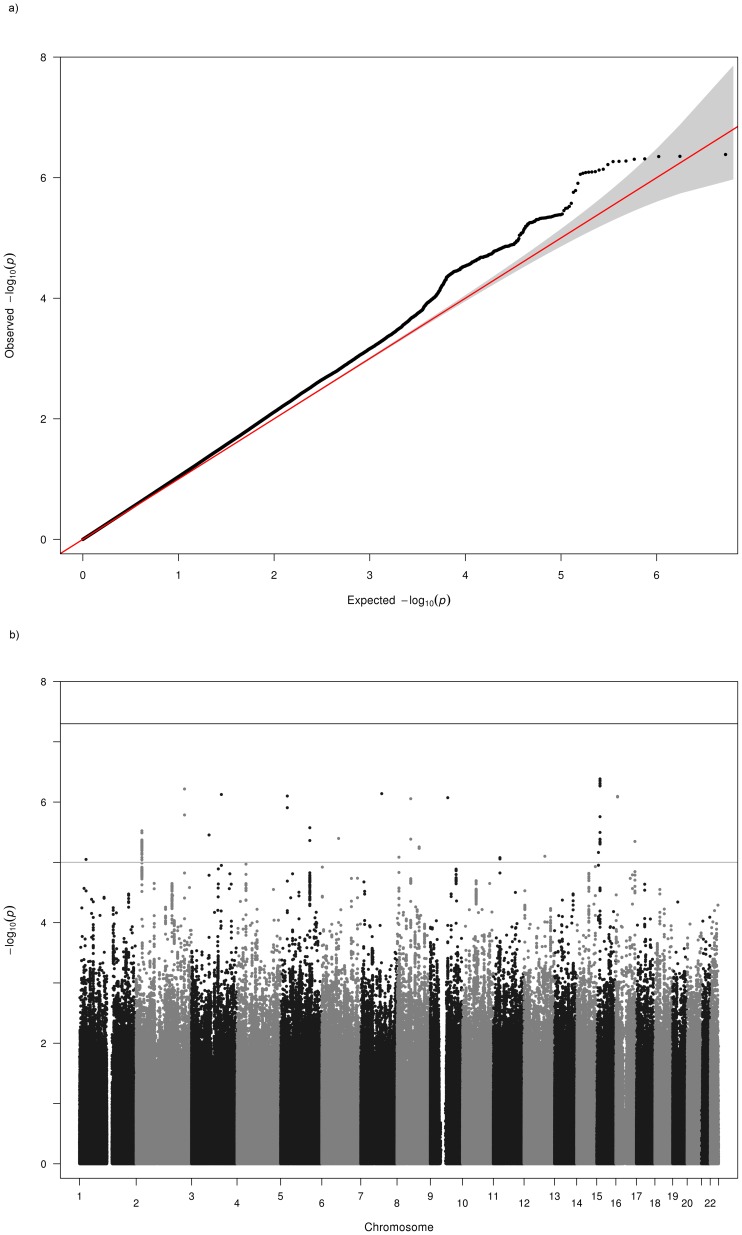
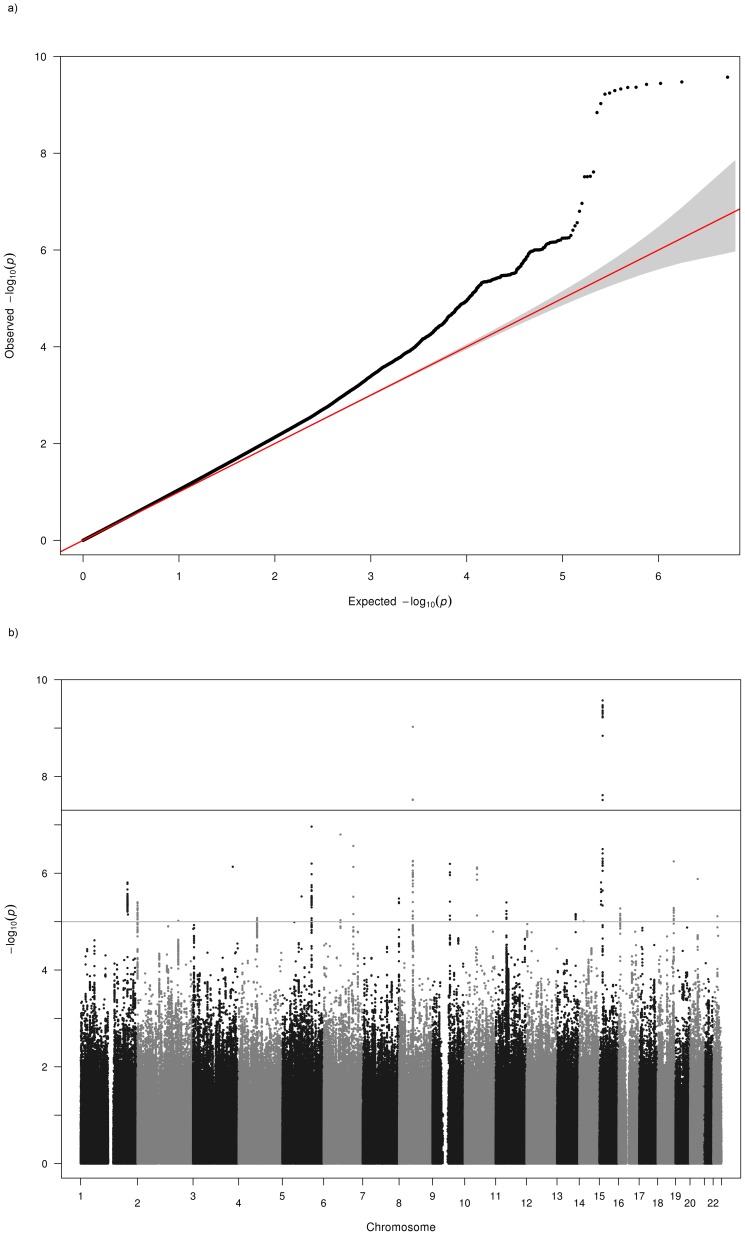
Refractive error (RE) is a complex, multifactorial disorder characterized by a mismatch between the optical power of the eye and its axial length that causes object images to be focused off the retina. The two major subtypes of RE are myopia (nearsightedness) and hyperopia (farsightedness), which represent opposite ends of the distribution of the quantitative measure of spherical refraction. We performed a fixed effects meta-analysis of genome-wide association results of myopia and hyperopia from 9 studies of European-derived populations: AREDS, KORA, FES, OGP-Talana, MESA, RSI, RSII, RSIII and ERF. One genome-wide significant region was observed for myopia, corresponding to a previously identified myopia locus on 8q12 (p = 1.25×10(-8)), which has been reported by Kiefer et al. as significantly associated with myopia age at onset and Verhoeven et al. as significantly associated to mean spherical-equivalent (MSE) refractive error. We observed two genome-wide significant associations with hyperopia. These regions overlapped with loci on 15q14 (minimum p value = 9.11×10(-11)) and 8q12 (minimum p value 1.82×10(-11)) previously reported for MSE and myopia age at onset. We also used an intermarker linkage- disequilibrium-based method for calculating the effective number of tests in targeted regional replication analyses. We analyzed myopia (which represents the closest phenotype in our data to the one used by Kiefer et al.) and showed replication of 10 additional loci associated with myopia previously reported by Kiefer et al. This is the first replication of these loci using myopia as the trait under analysis. "Replication-level" association was also seen between hyperopia and 12 of Kiefer et al.'s published loci. For the loci that show evidence of association to both myopia and hyperopia, the estimated effect of the risk alleles were in opposite directions for the two traits. This suggests that these loci are important contributors to variation of refractive error across the distribution.
Conflict of interest statement
Figures
References
-
- Kempen JH, Mitchell P, Lee KE, Tielsch JM, Broman AT, et al. (2004) The prevalence of refractive errors among adults in the United States, Western Europe, and Australia. Arch Ophthalmol 122: 495–505. - PubMed
-
- Vitale S, Sperduto RD, Ferris FL 3rd (2009) Increased prevalence of myopia in the United States between 1971–1972 and 1999–2004. Arch Ophthalmol 127: 1632–1639. - PubMed
-
- He M, Zeng J, Liu Y, Xu J, Pokharel GP, et al. (2004) Refractive error and visual impairment in urban children in southern china. Invest Ophthalmol Vis Sci 45: 793–799. - PubMed
-
- Lin LL, Shih YF, Hsiao CK, Chen CJ (2004) Prevalence of myopia in Taiwanese schoolchildren: 1983 to 2000. Ann Acad Med Singapore 33: 27–33. - PubMed
-
- Edwards MH, Lam CS (2004) The epidemiology of myopia in Hong Kong. Ann Acad Med Singapore 33: 34–38. - PubMed
Publication types
MeSH terms
Substances
Grants and funding
- N01 HC095168/HL/NHLBI NIH HHS/United States
- ZIA EY000403/ImNIH/Intramural NIH HHS/United States
- R01 DK077510/DK/NIDDK NIH HHS/United States
- N01-DK-6-2204/DK/NIDDK NIH HHS/United States
- HHSN268200782096C/HG/NHGRI NIH HHS/United States
- N01 HC-95159/HC/NHLBI NIH HHS/United States
- ZIAEY000403/PHS HHS/United States
- N01 HC095166/HL/NHLBI NIH HHS/United States
- MC_U127584475/MRC_/Medical Research Council/United Kingdom
- R01 EY016379/EY/NEI NIH HHS/United States
- N02-HL-6-4278/HL/NHLBI NIH HHS/United States
- UL1 RR033176/RR/NCRR NIH HHS/United States
- CZB/4/710/CSO_/Chief Scientist Office/United Kingdom
- CZB/4/438/CSO_/Chief Scientist Office/United Kingdom
- U01 DK094176/DK/NIDDK NIH HHS/United States
- N01-HC-95162/HC/NHLBI NIH HHS/United States
- UL1RR033176/RR/NCRR NIH HHS/United States
- UL1TR000124/TR/NCATS NIH HHS/United States
- N01 HC095161/HL/NHLBI NIH HHS/United States
- N01 HC095169/HL/NHLBI NIH HHS/United States
- Z99 EY999999/ImNIH/Intramural NIH HHS/United States
- RR-024156/RR/NCRR NIH HHS/United States
- N01-HC-95163/HC/NHLBI NIH HHS/United States
- N01-HC-95168/HC/NHLBI NIH HHS/United States
- Z01 EY000403/ImNIH/Intramural NIH HHS/United States
- UL1 RR024156/RR/NCRR NIH HHS/United States
- N01 HC095167/HL/NHLBI NIH HHS/United States
- R01-DK-077510/DK/NIDDK NIH HHS/United States
- 085475/B/08/Z/WT_/Wellcome Trust/United Kingdom
- K08 EY022943/EY/NEI NIH HHS/United States
- N01-HC-95165/HC/NHLBI NIH HHS/United States
- UL1 TR000114/TR/NCATS NIH HHS/United States
- UL1 TR000124/TR/NCATS NIH HHS/United States
- N01-HC-95169/HC/NHLBI NIH HHS/United States
- R01 EY020483/EY/NEI NIH HHS/United States
- R01EY020483/EY/NEI NIH HHS/United States
- N01-HC-95164/HC/NHLBI NIH HHS/United States
- N01-HC-95160/HC/NHLBI NIH HHS/United States
- MC_PC_U127561128/MRC_/Medical Research Council/United Kingdom
- N01 HC095163/HL/NHLBI NIH HHS/United States
- UL1 TR000142/TR/NCATS NIH HHS/United States
- N01-HC-95161/HC/NHLBI NIH HHS/United States
- WT_/Wellcome Trust/United Kingdom
- N01 HC095162/HL/NHLBI NIH HHS/United States
- N01-HC-95166/HC/NHLBI NIH HHS/United States
- 085475/08/Z/WT_/Wellcome Trust/United Kingdom
- SRF/01/010/DH_/Department of Health/United Kingdom
- N01 HC095165/HL/NHLBI NIH HHS/United States
- N01 HC095164/HL/NHLBI NIH HHS/United States
- N01 HC095159/HC/NHLBI NIH HHS/United States
- N01-HC-95167/HC/NHLBI NIH HHS/United States
- R01EY016379/EY/NEI NIH HHS/United States
- N01 HC095160/HL/NHLBI NIH HHS/United States
LinkOut - more resources
Full Text Sources
Other Literature Sources
Medical
Miscellaneous
