Comparative Study
. 2014 Nov;121(5):990-8.
doi: 10.1097/ALN.0000000000000436.

Effects of sevoflurane and propofol on frontal electroencephalogram power and coherence

Affiliations
Comparative Study

Effects of sevoflurane and propofol on frontal electroencephalogram power and coherence

Oluwaseun Akeju et al. Anesthesiology. 2014 Nov.

Abstract

Background: The neural mechanisms of anesthetic vapors have not been studied in depth. However, modeling and experimental studies on the intravenous anesthetic propofol indicate that potentiation of γ-aminobutyric acid receptors leads to a state of thalamocortical synchrony, observed as coherent frontal alpha oscillations, associated with unconsciousness. Sevoflurane, an ether derivative, also potentiates γ-aminobutyric acid receptors. However, in humans, sevoflurane-induced coherent frontal alpha oscillations have not been well detailed.

Methods: To study the electroencephalogram dynamics induced by sevoflurane, the authors identified age- and sex-matched patients in which sevoflurane (n = 30) or propofol (n = 30) was used as the sole agent for maintenance of general anesthesia during routine surgery. The authors compared the electroencephalogram signatures of sevoflurane with that of propofol using time-varying spectral and coherence methods.

Results: Sevoflurane general anesthesia is characterized by alpha oscillations with maximum power and coherence at approximately 10 Hz, (mean ± SD; peak power, 4.3 ± 3.5 dB; peak coherence, 0.73 ± 0.1). These alpha oscillations are similar to those observed during propofol general anesthesia, which also has maximum power and coherence at approximately 10 Hz (peak power, 2.1 ± 4.3 dB; peak coherence, 0.71 ± 0.1). However, sevoflurane also exhibited a distinct theta coherence signature (peak frequency, 4.9 ± 0.6 Hz; peak coherence, 0.58 ± 0.1). Slow oscillations were observed in both cases, with no significant difference in power or coherence.

Conclusions: The study results indicate that sevoflurane, like propofol, induces coherent frontal alpha oscillations and slow oscillations in humans to sustain the anesthesia-induced unconscious state. These results suggest a shared molecular and systems-level mechanism for the unconscious state induced by these drugs.


Conflict of interest statement

All other authors declare no competing interests.

Figures

Figure 1
Figure 1
Representative individual spectrogram and the time-domain electroencephalogram data obtained during sevoflurane general anesthesia (GA), and propofol GA. A. Spectrogram of a patient who received sevoflurane GA. B. Spectrogram of a patient who received propofol GA. The spectrogram displays the frequency content of signals as they change over time. Frequency is plotted on the y-axis, time is plotted on the x-axis, and the energy or power in the signal is indicated in color. Both spectrograms show power in the slow and alpha frequency bands. However, sevoflurane GA is further characterized by increased power in the theta and beta frequency bands. C. Representative 10-s electroencephalogram traces of sevoflurane GA. D. Representative 10-s electroencephalogram traces of propofol GA illustrating the gross similarities in electroencephalogram signal amplitudes in fig. 1C. E–L. Bandpass filtered electroencephalogram signals from the raw tracings to more clearly illustrate gross similarities in the electroencephalogram.
Figure 2
Figure 2
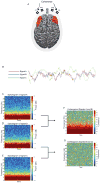
Illustration of electroencephalogram channels, and coherence measurement. A. Visual representation of channel locations and the two bipolar frontal channels, F7 and F8, which we used for coherence analysis. Areas in red are purely illustrative for the explanation of coherence. The bipolar frontal channels overlaying these regions may not record signals solely from the underlying cortex. B. Simulated signals to illustrate interpretation of coherence. Signal “A” and signal “B” appear highly correlated in time, whereas signal “C” appears uncorrelated with both signals A and B. C–E. Spectrogram for simulated signals in 2B. The spectrogram plots signal power or energy as a function of time and frequency. Signals A, B and C produce almost identical spectrograms, however their coherograms will reflect differences in functional connectivity that may otherwise be overlooked. F–G. The coherence indicates the correlation coefficient between two signals as a function of frequency (0 for no correlation, with a maximum value of 1 for perfect correlation). The coherogram plots the coherence as function of time, much like the spectrogram. This example shows how the simulated signals have identical spectrograms, but very different coherograms, consistent with the degree of correlation evident in the time domain traces shown in 2B. The coherogram also indicates the frequencies over which two signals are correlated. In this example, signals A and B are correlated at frequencies below approximately 20 Hz.
Figure 3
Figure 3
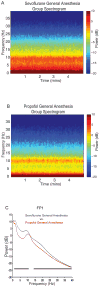
Group level spectral analysis comparing sevoflurane general anesthesia (GA) to propofol GA. A. Group level spectrogram of sevoflurane GA (n = 30), showing increased power in slow, delta, theta and alpha, beta frequency bands. B. Group level spectrogram of propofol GA (n=30), showing increased power in slow, delta, and alpha frequency bands. C. Power spectra of sevoflurane GA versus propofol GA. Electroencephalogram power is significantly greater with sevoflurane GA over propofol GA across a broad frequency range spanning the alpha, delta, theta and beta frequency bands (fig. 3C; 0.4–11.2 Hz, 14.7–40Hz; P < 0.001, two group test for spectra). Median spectra presented with 95% jackknife confidence intervals. Horizontal solid black lines represent frequency ranges at which there was significant difference.
Figure 4
Figure 4
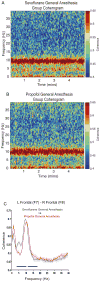
Group level coherence analysis comparing sevoflurane general anesthesia (GA) to propofol GA. A. Group level coherogram of sevoflurane GA (n = 30) showing coherence in the theta and alpha frequency bands. B. Group level coherogram of propofol GA (n = 30), showing coherence in the alpha frequency band. C. Coherence of sevoflurane GA versus propofol GA. Qualitatively, the alpha coherence between the two groups appeared similar. However, sevoflurane exhibited a theta coherence peak. Sevoflurane GA coherence across was higher than propofol GA at 3.41–10.7Hz (two group test for coherence, P < 0.001). Propofol GA coherence across was higher than sevoflurane GA at 11.7–19.5Hz (two group test for coherence, P < 0.001). Median coherence presented with 95% jackknife confidence intervals. Horizontal solid black lines represent frequency ranges at which there was significant difference.

References

    1. Eger EI., 2nd New inhaled anesthetics. Anesthesiology. 1994;80:906–22. - PubMed
    1. Campagna JA, Miller KW, Forman SA. Mechanisms of actions of inhaled anesthetics. N Engl J Med. 2003;348:2110–24. - PubMed
    1. Alkire MT, Hudetz AG, Tononi G. Consciousness and anesthesia. Science. 2008;322:876–80. - PMC - PubMed
    1. Franks NP. General anaesthesia: From molecular targets to neuronal pathways of sleep and arousal. Nat Rev Neurosci. 2008;9:370–86. - PubMed
    1. Rudolph U, Antkowiak B. Molecular and neuronal substrates for general anaesthetics. Nat Rev Neurosci. 2004;5:709–20. - PubMed

Publication types