. 2014 Sep 18;10(9):e1004394.
doi: 10.1371/journal.ppat.1004394. eCollection 2014 Sep.

Exploitation of Mycobacterium tuberculosis reporter strains to probe the impact of vaccination at sites of infection

Affiliations

Exploitation of Mycobacterium tuberculosis reporter strains to probe the impact of vaccination at sites of infection

Neelima Sukumar et al. PLoS Pathog. .

Abstract

Mycobacterium tuberculosis (Mtb) remains a major public health problem, with an effective vaccine continuing to prove elusive. Progress in vaccination strategies has been hampered by a lack of appreciation of the bacterium's response to dynamic changes in the host immune environment. Here, we utilize reporter Mtb strains that respond to specific host immune stresses such as hypoxia and nitric oxide (hspX'::GFP), and phagosomal maturation (rv2390c'::GFP), to investigate vaccine-induced alterations in the environmental niche during experimental murine infections. While vaccination undoubtedly decreased bacterial burden, we found that it also appeared to accelerate Mtb's adoption of a phenotype better equipped to survive in its host. We subsequently utilized a novel replication reporter strain of Mtb to demonstrate that, in addition to these alterations in host stress response, there is a decreased percentage of actively replicating Mtb in vaccinated hosts. This observation was supported by the differential sensitivity of recovered bacteria to the front-line drug isoniazid. Our study documents the natural history of the impact that vaccination has on Mtb's physiology and replication and highlights the value of reporter Mtb strains for probing heterogeneous Mtb populations in the context of a complex, whole animal model.


Conflict of interest statement

The authors have declared that no competing interests exist.

Figures

Figure 1
Figure 1. Characterization of a heat-killed Mtb vaccination model.
(A) Kinetics of Mtb colonization in vaccinated or mock-treated mice lungs. C57BL/6J mice were intraperitoneally injected with 5×10⁵ CFUs of heat-killed Erdman or with sterile PBS (mock-treated). Four weeks post-vaccination, mice were challenged with 103 CFUs of various reporter Mtb intranasally. At indicated time points post-challenge, mice were sacrificed and the bacterial burden in the lungs determined. The pooled data for each time point are shown as means ± SEM, from at least 3 animals per data point. * indicates p<0.05 (unpaired t-test). (B) Lung pathology of vaccinated and mock-treated mice. Lungs collected at indicated time points post-challenge were fixed in 4% paraformaldehyde and subjected to routine H&E staining. Scale bar 200 µm.
Figure 2
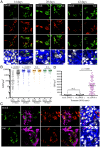
Figure 2. Differences in expression of rv2390c′::GFP in Mtb present in vaccinated versus mock-treated mice.
Erdman(rv2390c′::GFP, smyc′::mCherry) was inoculated into vaccinated or mock-treated C57BL/6J WT mice for up to 56 days. (A) shows 3D confocal images from a 14, 28, or 42 day infection. All bacteria are marked in red (smyc′::mCherry), reporter signal is shown in green (rv2390c′::GFP), nuclei are marked in grayscale (DAPI), and phalloidin staining of f-actin is shown in blue. Scale bar 10 µm. (B) shows quantification of the GFP/µm3 signal for each bacterium measured from multiple 3D confocal images, at the indicated time points. Each point on the graph represents a bacterium or a tightly clustered group of bacteria (mock-treated – filled symbols, vaccinated – open symbols). Horizontal lines mark the median value for each group. p-values were obtained with a Mann-Whitney statistical test.
Figure 3
Figure 3. Differences in expression of hspX′::GFP in Mtb present in vaccinated versus mock-treated mice.
(A and B) Higher hspX′::GFP induction in vaccinated mice at 14 days post-challenge. Erdman(hspX′::GFP, smyc′::mCherry) was inoculated into vaccinated or mock-treated C57BL/6J WT mice for up to 56 days. (A) shows 3D confocal images from a 14, 28, or 42 day infection. All bacteria are marked in red (smyc′::mCherry), reporter signal is shown in green (hspX′::GFP), nuclei are marked in grayscale (DAPI), and phalloidin staining of f-actin is shown in blue. Scale bar 10 µm. (B) shows quantification of the GFP/µm3 signal for each bacterium measured from multiple 3D confocal images, at the indicated time points. Each point on the graph represents a bacterium or a tightly clustered group of bacteria (mock-treated – filled symbols, vaccinated – open symbols). Horizontal lines mark the median value for each group. p-values were obtained with a Mann-Whitney statistical test. (C and D) hspX′::GFP-positive Mtb reside in iNOS-positive mouse lung regions. Erdman(hspX′::GFP, smyc′::mCherry) was inoculated into vaccinated or mock-treated C57BL/6J WT mice for 14 days. (C) shows 3D confocal images, with all bacteria marked in red (smyc′::mCherry), reporter signal shown in green (hspX′::GFP), iNOS stained in magenta, nuclei marked in grayscale (DAPI), and phalloidin staining of f-actin shown in blue. Scale bar 10 µm. (D) shows quantification of the bacterial GFP/µm3 signal, measured as in (B), in Mtb present in iNOS-positive versus negative regions. Horizontal lines mark the median value for each group. p-values were obtained with a Mann-Whitney statistical test.
Figure 4
Figure 4. Dynamics of rv2390c′::GFP induced fluorescence in immune-deficient vaccinated versus mock-treated mice.
(A) Bacterial burden in vaccinated and mock-treated IFNγ−/− mice. Reporter Mtb strains were inoculated into vaccinated or mock-treated C57BL/6J IFNγ−/− mice for up to 28 days. CFUs were determined by plating lung homogenates at 14 or 28 days post-challenge (mock-treated – filled symbols, vaccinated – open symbols). Horizontal lines mark the median value for each group. p-values were obtained with a Mann-Whitney statistical test. (B and C) rv2390c′::GFP induced fluorescence in vaccinated or mock-treated WT versus IFNγ−/− mice. Erdman(rv2390c′::GFP, smyc′::mCherry) was inoculated into vaccinated or mock-treated C57BL/6J WT or IFNγ−/− mice for up to 28 days. (B) shows 3D confocal images from a 14 day infection, with all bacteria marked in red (smyc′::mCherry), reporter signal shown in green (rv2390c′::GFP), nuclei marked in grayscale (DAPI), and phalloidin staining of f-actin shown in blue. Scale bar 10 µm. (C) shows quantification of the GFP/µm3 signal for each bacterium measured from multiple 3D confocal images, at the indicated time points. Each point on the graph represents a bacterium or a tightly clustered group of bacteria (mock-treated – filled symbols, vaccinated – open symbols; WT mice infections – black, IFNγ−/− mice infections - red). Data for WT mice infections are as shown in Figure 2B. Horizontal lines mark the median value for each group. p-values were obtained with a Mann-Whitney statistical test.
Figure 5
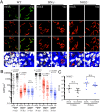
Figure 5. Dynamics of hspX′::GFP induced fluorescence in immune-deficient vaccinated versus mock-treated mice.
(A and B) hspX′::GFP induced fluorescence in vaccinated or mock-treated IFNγ−/− and NOS2−/− mice. Erdman(hspX′::GFP, smyc′::mCherry) was inoculated into vaccinated or mock-treated C57BL/6J WT, IFNγ−/−, or NOS2−/− mice for up to 28 days. (A) shows 3D confocal images from a 14 day infection, with all bacteria marked in red (smyc′::mCherry), reporter signal shown in green (hspX′::GFP), nuclei marked in grayscale (DAPI), and phalloidin staining of f-actin shown in blue. Scale bar 10 µm. (B) shows quantification of the GFP/µm3 signal for each bacterium measured from multiple 3D confocal images, at the indicated time points. Each point on the graph represents a bacterium or a tightly clustered group of bacteria (mock-treated – filled symbols, vaccinated – open symbols; WT mice infections – black, IFNγ−/− mice infections – red, NOS2−/− mice infections - blue). Data for WT mice infections are as shown in Figure 3B. Horizontal lines mark the median value for each group. p-values were obtained with a Mann-Whitney statistical test. (C) Bacterial burden in vaccinated and mock-treated NOS2−/− mice. Erdman(hspX′::GFP, smyc′::mCherry) was inoculated into vaccinated or mock-treated NOS2−/− mice for up to 28 days. CFUs were determined by plating lung homogenates at 14 or 28 days post-challenge (mock-treated – filled symbols, vaccinated – open symbols). Horizontal lines mark the median value for each group. p-values were obtained with a Mann-Whitney statistical test.
Figure 6
Figure 6. Mtb replication in vaccinated versus mock-treated mice.
(A) SSB-GFP defines cell cycle timing in M. smegmatis. SSB-GFP expressing M. smegmatis cells were imaged every 15 minutes while growing in a microfluidic device (as described in [38]) in 7H9 supplemented with 10% ADC, 0.2% glycerol, 0.05% Tween 80, and 50 µg/ml hygromycin B. The medium was further supplemented with 2% DMSO and 0.0625 µg/ml FM4-64 FX to visualize septal membranes. The number of SSB-GFP foci (gray, inside of the chart) indicates the status of DNA replication in single cells. The average time in each period of the cell cycle is indicated (n = 122). B (G1) is the period after division but before initiation of DNA replication, C (S) is the period of DNA replication, and D (G2) is the period between the termination of DNA replication and division (defined as cell wall pinching or v-snapping). Some cells begin a new round of replication before division; daughters of these cells do not spend time in B. Standard deviations are 19, 38, 26, and 13 minutes for B, C, D, and pre-division replication, respectively. (B–D) Erdman(SSB-GFP, smyc′::mCherry) was inoculated into vaccinated or mock-treated C57BL/6J WT or IFNγ−/− mice for up to 28 days. (B) shows the percentage of Mtb displaying SSB-GFP foci for each mouse, measured from multiple 3D confocal images, at 14 days post-challenge. Each point on the graph represents a mouse (mock-treated – filled symbols, vaccinated – open symbols; WT mice infections – black, IFNγ−/− mice infections – red). Horizontal lines mark the median value for each group. (C) shows 3D confocal images from a 28 day infection, with all bacteria marked in red (smyc′::mCherry), reporter signal shown in green (SSB-GFP), nuclei marked in grayscale (DAPI), and phalloidin staining of f-actin shown in blue. For clarity of foci visualization, SSB-GFP signal is shown in extended focus, overlaid on the 3D image. Scale bar 10 µm. (D) shows the percentage of Mtb displaying SSB-GFP signal for each mouse, measured as in (B), at 28 days post-challenge. Each point on the graph represents a mouse (mock-treated – filled symbols, vaccinated – open symbols; WT mice infections – black, IFNγ−/− mice infections – red). Horizontal lines mark the median value for each group. p-values were obtained with a Mann-Whitney statistical test.
Figure 7
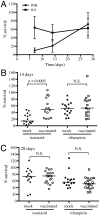
Figure 7. Mtb in vaccinated lungs display higher tolerance to isoniazid but not rifampicin.
(A) Kinetics of tolerance of Mtb to INH and Rif in mock-treated mice. Erdman reporter strains were inoculated into C57BL/6J WT mice for up to 28 days. Lung homogenates collected at days 7, 14 and 28 post-challenge were subjected to treatment with 0.4 µg/ml INH or Rif, or DMSO as a control, for 18–20 hours, and the percentage of Mtb surviving INH or Rif treatment determined. (B and C) Erdman reporter strains were inoculated into vaccinated or mock-treated C57BL/6J WT mice for up to 28 days. Lung homogenates collected from vaccinated or mock-treated mice at days 14 (B) or 28 (C) post-challenge were subjected to treatment with 0.4 µg/ml INH or Rif, or DMSO as a control, for 18–20 hours, and the percentage of Mtb surviving INH or Rif treatment determined. Each point on the graph represents a mouse (mock-treated – filled symbols, vaccinated – open symbols; circle – INH treatment, square – Rif treatment). Horizontal lines mark the median value for each group. p-values were obtained with a Mann-Whitney statistical test.

References

    1. da Costa AC, Nogueira SV, Kipnis A, Junqueira-Kipnis AP (2014) Recombinant BCG: Innovations on an Old Vaccine. Scope of BCG Strains and Strategies to Improve Long-Lasting Memory. Front Immunol 5: 152. - PMC - PubMed
    1. Sable SB, Cheruvu M, Nandakumar S, Sharma S, Bandyopadhyay K, et al. (2011) Cellular immune responses to nine Mycobacterium tuberculosis vaccine candidates following intranasal vaccination. PLoS ONE 6: e22718. - PMC - PubMed
    1. Bertholet S, Ireton GC, Ordway DJ, Windish HP, Pine SO, et al. (2010) A defined tuberculosis vaccine candidate boosts BCG and protects against multidrug-resistant Mycobacterium tuberculosis . Sci Transl Med 2: 53ra74. - PMC - PubMed
    1. Aagaard C, Hoang T, Dietrich J, Cardona PJ, Izzo A, et al. (2011) A multistage tuberculosis vaccine that confers efficient protection before and after exposure. Nat Med 17: 189–194. - PubMed
    1. Orme IM (2013) Vaccine development for tuberculosis: current progress. Drugs 73: 1015–1024. - PMC - PubMed

Publication types

MeSH terms