

Customized reference ranges for laboratory values decrease false positive alerts in intensive care unit patients
- PMID: 25233485
- PMCID: PMC4169437
- DOI: 10.1371/journal.pone.0107930
Customized reference ranges for laboratory values decrease false positive alerts in intensive care unit patients
Abstract
Background: Traditional electronic medical record (EMR) interfaces mark laboratory tests as abnormal based on standard reference ranges derived from healthy, middle-aged adults. This yields many false positive alerts with subsequent alert-fatigue when applied to complex populations like hospitalized, critically ill patients. Novel EMR interfaces using adjusted reference ranges customized for specific patient populations may ameliorate this problem.
Objective: To compare accuracy of abnormal laboratory value indicators in a novel vs traditional EMR interface.
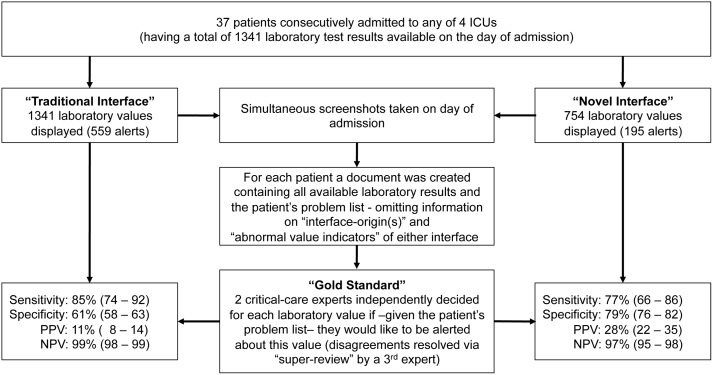
Methods: Laboratory data from intensive care unit (ICU) patients consecutively admitted during a two-day period were recorded. For each patient, available laboratory results and the problem list were sent to two mutually blinded critical care experts, who marked the values about which they would like to be alerted. All disagreements were resolved by an independent super-reviewer. Based on this gold standard, we calculated and compared the sensitivity, specificity, positive and negative predictive values (PPV, NPV) of customized vs traditional abnormal value indicators.
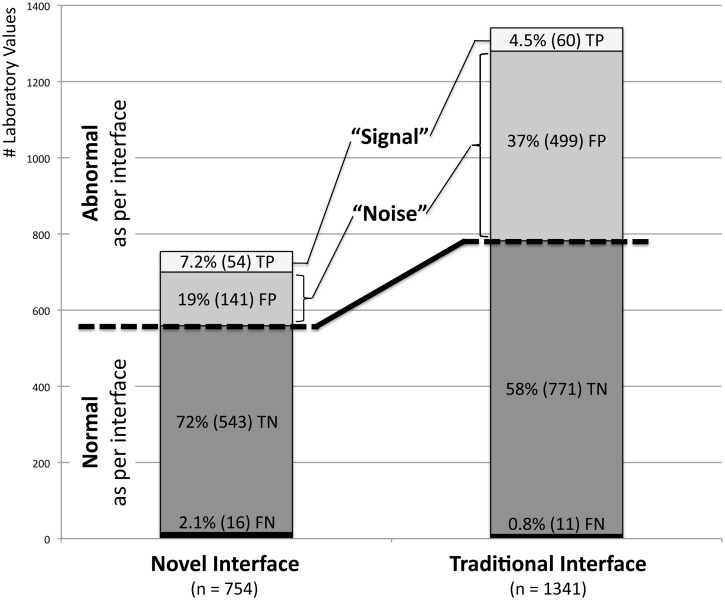
Results: Thirty seven patients with a total of 1341 laboratory results were included. Experts' agreement was fair (kappa = 0.39). Compared to the traditional EMR, custom abnormal laboratory value indicators had similar sensitivity (77% vs 85%, P = 0.22) and NPV (97.1% vs 98.6%, P = 0.06) but higher specificity (79% vs 61%, P < 0.001) and PPV (28% vs 11%, P < 0.001).
Conclusions: Reference ranges for laboratory values customized for an ICU population decrease false positive alerts. Disagreement among clinicians about which laboratory values should be indicated as abnormal limits the development of customized reference ranges.
Conflict of interest statement
Figures
References
-
- Lundberg G (1972) When to panic over abnormal values. Med Lab Observer 4: 47–54.
-
- The Joint Commission on Accreditation of Healthcare Organizations: “Laboratory Services: 2014 National Patient Safety Goals”. Available: http://www.jointcommission.org/standards_information/npsgs.aspx Accessed 2013 Dec 10.
-
- Rivers E, Nguyen B, Havstad S, Ressler J, Muzzin A, et al. (2001) Early goal-directed therapy in the treatment of severe sepsis and septic shock. N Engl J Med 345: 1368–1377. - PubMed
-
- Hwang MI, Lin JW (1999) Information dimension, information overload and decision quality. Journal of Information Science 25: 213–218.
-
- Pickering BW, Gajic O, Alvarez CAT, Afessa B, Keegan MT (2009) Patient Data Utilization at Intensive Care Unit Admission. Am J Respir Crit Care Med 179: A3115.
Publication types
MeSH terms
Grants and funding
LinkOut - more resources
Full Text Sources
Other Literature Sources
Medical
