. 2014 Sep 19:13:218.
doi: 10.1186/1476-4598-13-218.

OncomiR-196 promotes an invasive phenotype in oral cancer through the NME4-JNK-TIMP1-MMP signaling pathway

Affiliations

OncomiR-196 promotes an invasive phenotype in oral cancer through the NME4-JNK-TIMP1-MMP signaling pathway

Ya-Ching Lu et al. Mol Cancer. .

Abstract

Background: MicroRNA-196 (miR-196), which is highly up-regulated in oral cancer cells, has been reported to be aberrantly expressed in several cancers; however, the significance of miR-196 in oral cancer has not yet been addressed.

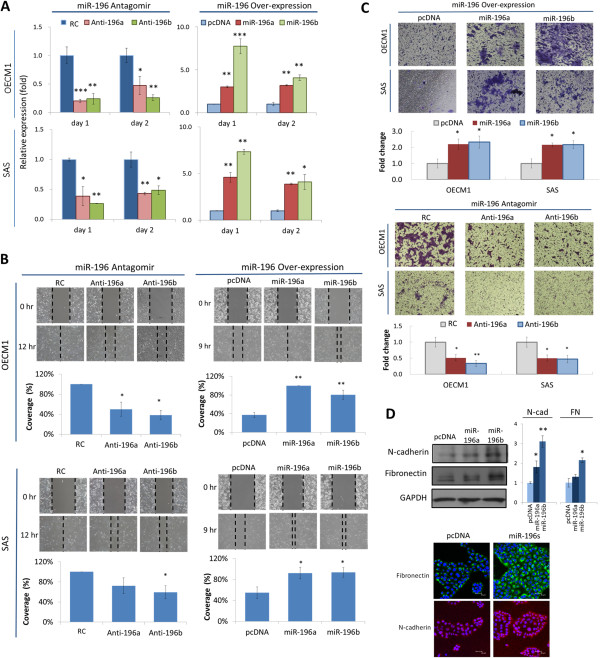
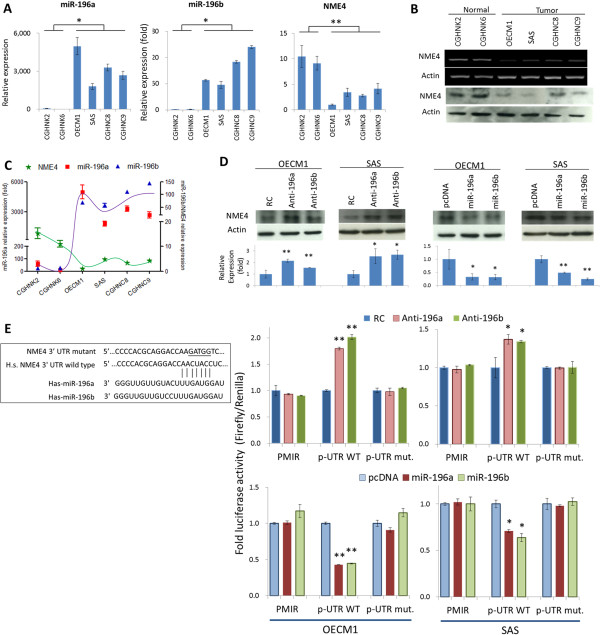
Methods: Cellular functions in response to miR-196 modulation were examined, including cell growth, migration, invasion and radio/chemosensitivity. Algorithm-based studies were used to identify the regulatory target of miR-196. The miR-196 target gene and downstream molecular mechanisms were confirmed by RT-qPCR, western blot, luciferase reporter and confocal microscopy analyses. miR-196 expression was determined in paired cancer and adjacent normal tissues from oral cancer patients.

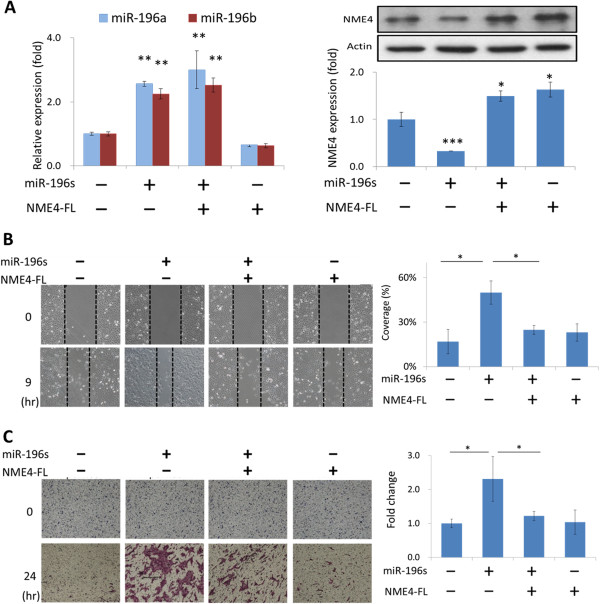
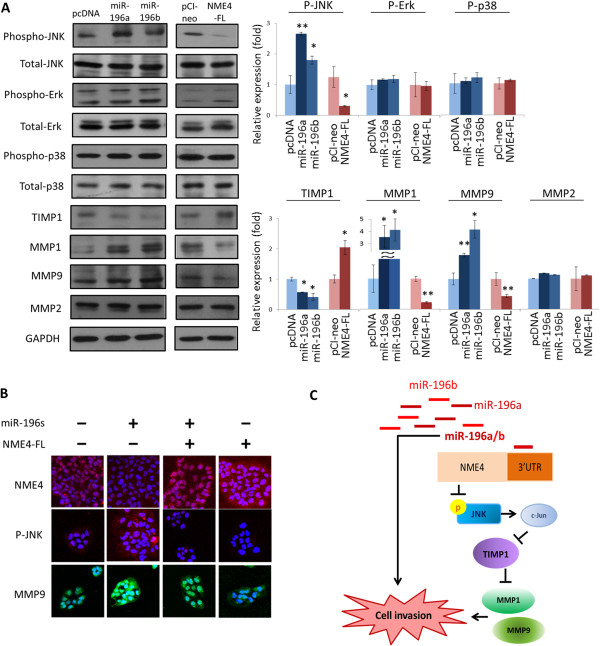
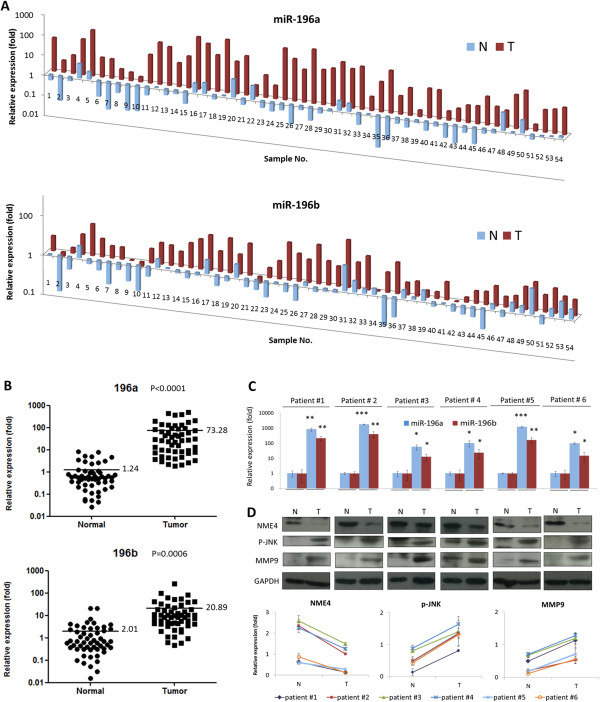
Results: Both miR-196a and miR-196b were highly over-expressed in the cancer tissue and correlated with lymph node metastasis (P = 0.001 and P = 0.006, respectively). Functionally, miR-196 actively promoted cell migration and invasion without affecting cell growth. Mechanistically, miR-196 performed it's their function by inhibiting NME4 expression and further activating p-JNK, suppressing TIMP1, and augmenting MMP1/9.

Conclusion: miR-196 contributes to oral cancer by promoting cell migration and invasion. Clinically, miR-196a/b was significantly over-expressed in the cancer tissues and correlated with lymph node metastasis. Thus, our findings provide new knowledge of the underlying mechanism of cancer metastasis. miR-196 may serve as a promising marker for better oral cancer management.


Figures

Figure 1
Figure 1
Both miR-196a and miR-196b promote migration and invasion without affecting cell growth. (A) Modulation of miR-196a and miR-196b expression after transfection of specific antagomirs or over-expression plasmids into OECM1 and SAS cells. These included miR-196 antagomirs (Anti-196a, Anti-196b), the random sequence for antigomir control (RC), the over-expression plasmids (miR-196a, miR-196b), or the expression vector (pcDNA). After 1 days of transfection, cells were harvested, and the levels of miR-196a and miR-196b were determined as described in the Methods section. (B) Effect of miR-196 modulation on cell growth and colony formation. After transfection of miR-196–specific antagomirs (Anti-196a, Anti-196b) or random oligonucleotides (RC) for 1 day, 1 × 106 cells were re-seeded in 100 mm plates with for 3 days to allow cell growth, or 1 × 105 cells were seeded for 7 days to allow colony formation. The number of colonies was determined. (C) Cells after modulating miR-196 level were applied to an in vitro wound healing migration assay as described in the Methods section. Cell migration toward the gap was observed, photographed, and quantified at the indicated times. (D) Effects of miR-196 modulation on cell invasion. After the transfection of miR-196 overexpression plasmids or the antagomir oligonucleotides, cells were subjected to a Matrigel invasion assay as described in the Methods section. The cells that invaded through the Matrigel-coated membranes to the lower chamber were stained, photographed, and quantified at the indicated times. (*p < 0.05 , **p < 0.01, ***p < 0.005, t-test).
Figure 2
Figure 2
NME4 is a direct regulatory target of miR-196. (A) Differential expression of miR-196a/b and NME4 mRNA in two immortalized normal keratinocyte and four oral cancer cell lines, as determined by RT-qPCR. Relative levels of miR-196a/b were determined after normalization to the U6 RNA level (internal control) for each sample. The NME4 RNA level was normalized to actin for each sample. (B) Differential expression of NME4 mRNA and protein in two immortalized normal keratinocyte and four oral cancer cell lines, as determined by RT-PCR and western blotting. Actin expression was also determined as an internal control. (C) Inverse correlation between NME4 and miR-196a/b expression which determined by RT-qPCR. (D) Effect of miR-196 modulation on NME4 mRNA expression. OECM1 and SAS cells transfected with miR-196a/b–specific antagomirs or overexpression plasmids were harvested. Total protein was extracted and subjected to western blot analysis of NME4 expression. The relative expression was determined after normalization to actin as an internal control. (E) The mature sequences of miR-196a and miR-196b, as well as the 3′-UTR sequence of the human NME4 gene, are shown. The mutant sequence of the 3′-UTR region of NEM4 was designed. Luciferase reporter assay was performed to determine whether NME4 is a direct miR-196a/b target gene. Cells transfected with miR-196–specific antagomirs or overexpression plasmids were co-transfected with pMIR, p-UTR-WT, or p-UTR-mut. Renilla luciferase was also transfected as a reference control for each condition. Firefly and Renilla luciferase activities were measured using the dual-luciferase reporter assay. (*p < 0.05 , **p < 0.01, ***p < 0.005, t-test).
Figure 3
Figure 3
NME4 suppressed the effect of miR-196s on cell migration and invasion. (A) Verification of the expression status of miR-196 s and NME4 after transfection of the miR-196 overexpression or NME4 plasmids. After the transfection of miR-196 and/or NME4 plasmids into OECM1 cells, cell invasion (B) and migration (C) were examined as described in the Methods section. The empty vectors (pcDNA for miR-196 and pCIneo for NME4) were added if necessary to make total DNA amount being equally used in all experiments. (*p < 0.05, **p < 0.01, ***p < 0.005, t-test).
Figure 4
Figure 4
Cellular effect of miR-196 is exerted via the NME4-JNK-TIMP1-MMP1/9 molecular pathway in OECM1 cells. (A) Effects of miR-196 or NME4 plasmid transfection on MAPK, TIMP1 and MMP protein expression in OECM1 cells. Protein expression was determined by western blot analysis, and the density of each band was quantified. (B) Effect of miR-196 or NME4 plasmid transfection on p-JNK and MMP9 expression in OECM1 cells. Protein expression was determined by immunofluorescence staining and confocal microscopy. (C) A hypothetical model illustrating the miR-196-NME4-JNK-TIMP1-MMP1/9 molecular signaling pathway in oral cancer. (*p < 0.05, **p < 0.01, ***p < 0.005, t-test).
Figure 5
Figure 5
High expression of miR-196a and miR-196b in cancer tissues. A total of 54 paired cancer (T) and adjacent normal (N) tissues were obtained from patients with oral cancer. (A) For each sample, the expression levels of miR-196a and miR-196b were determined by RT-qPCR and normalized to U6 RNA as an internal control. (B) The relative expression of each sample is illustrated. The scatter dot plot shows the relative levels of miR-196a and miR-196b in the cancer and normal tissues from the patients. (C-D) Six paired of normal and oral cancer tissues were examined. (C) The expression level of miR-196a and miR-196b in the pairs of sample were determined by RT-qPCR based method. (D) The protein expressions of NME4, p-JNK and MMP9 were determined by western blot method, and showing GAPDH level as an internal control. Relative expressions of NME4, pJNK and MMP9 in each paired tissues. The density of each protein band was quantified after normalization to the GAPDH in each sample. The lines indicate the tendency of altered expressions of NME4, pJNK and MMP9 in each paired tissues. (*p < 0.05, **p < 0.01, ***p < 0.005, t-test).

References

    1. Warnakulasuriya S. Global epidemiology of oral and oropharyngeal cancer. Oral Oncol. 2009;45:309–316. doi: 10.1016/j.oraloncology.2008.06.002. - DOI - PubMed
    1. Chen YJ, Chang JT, Liao CT, Wang HM, Yen TC, Chiu CC, Lu YC, Li HF, Cheng AJ. Head and neck cancer in the betel quid chewing area: recent advances in molecular carcinogenesis. Cancer Sci. 2008;99:1507–1514. doi: 10.1111/j.1349-7006.2008.00863.x. - DOI - PMC - PubMed
    1. Stucken E, Weissman J, Spiegel JH. Oral cavity risk factors: experts' opinions and literature support. J Otolaryngol. 2010;39:76–89. - PubMed
    1. Saman DM. A review of the epidemiology of oral and pharyngeal carcinoma: update. Head Neck Oncol. 2012;4:1. doi: 10.1186/1758-3284-4-1. - DOI - PMC - PubMed
    1. Garzon R, Marcucci G, Croce CM. Targeting microRNAs in cancer: rationale, strategies and challenges. Nat Rev Drug Discov. 2010;9:775–789. doi: 10.1038/nrd3179. - DOI - PMC - PubMed

Publication types

MeSH terms

Substances