

Review
doi: 10.1053/j.semnuclmed.2014.05.004.
Noninvasive imaging in coronary artery disease
Affiliations
- PMID: 25234083
- PMCID: PMC4191722
- DOI: 10.1053/j.semnuclmed.2014.05.004
Item in Clipboard
Review
Noninvasive imaging in coronary artery disease
Semin Nucl Med.
2014 Sep.
Abstract
Noninvasive cardiac imaging is widely used to evaluate the presence of coronary artery disease. Recently, with improvements in imaging technology, noninvasive imaging has also been used for evaluation of the presence, severity, and prognosis of coronary artery disease. Coronary CT angiography and MRI of coronary arteries provide an anatomical assessment of coronary stenosis, whereas the hemodynamic significance of a coronary artery stenosis can be assessed by stress myocardial perfusion imaging, such as SPECT/PET and stress MRI. For appropriate use of multiple imaging modalities, the strengths and limitations of each modality are discussed in this review.
Copyright © 2014 Elsevier Inc. All rights reserved.
Figures
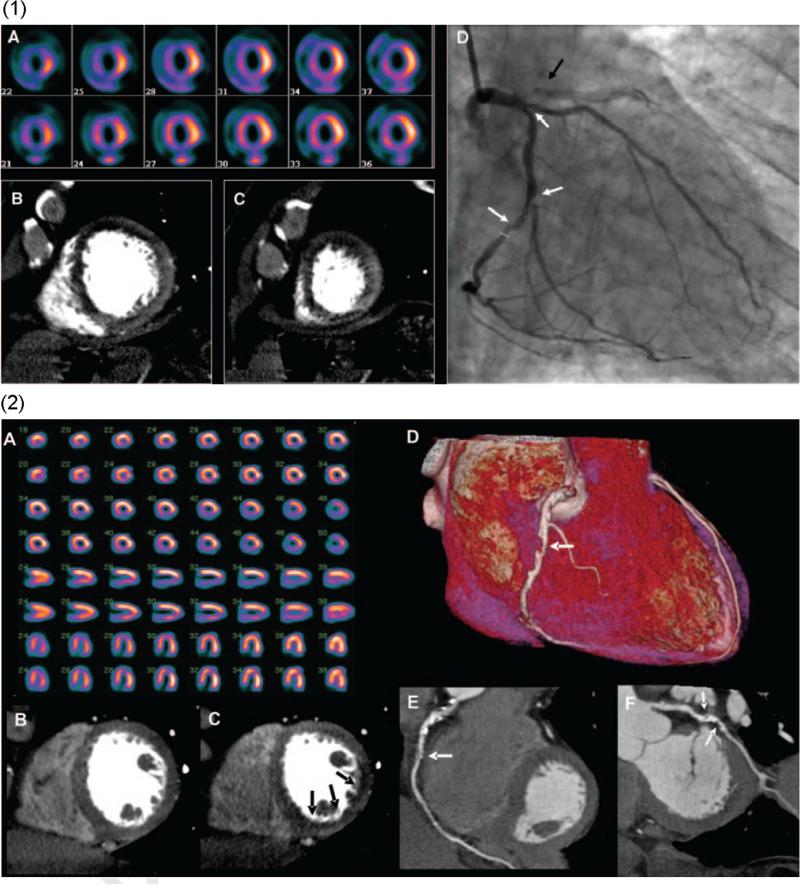
(1) Images from a 64-row detector CTP. (A) A partially reversible perfusion deficit in the territory of the LAD and a primarily fixed perfusion deficit in the inferior wall on radionuclide myocardial perfusion imaging with increased subdiaphragmatic tracer uptake (stress, upper panels; rest, lower panels). (B and C) Adenosine stress CTP shows a dense perfusion deficit in the LAD territory and a subendocardial perfusion deficit in the inferior and lateral walls. (D) An invasive coronary angiogram demonstrates a left-dominant system with a totally occluded LAD (black arrow) as well as intermediate- and high-grade stenoses in a large ramus intermedius, the body of the left circumflex, and the ostium of the obtuse marginal artery (white arrows). (2) Images from a 256-row detector CTP. (A) A partially reversible perfusion deficit in the inferior and inferolateral wall on radionuclide MPI in this patient with exertional angina (stress, upper panels; rest, lower panels). Rest (B) and stress (C) CTP imaging shows a reversible subendocardial perfusion deficit in the inferior and inferolateral walls. Noninvasive angiography confirms a significant stenosis (white arrows) in the proximal right coronary artery (D and E) and the proximal left circumflex artery (F). (Color version of figure is available online.)
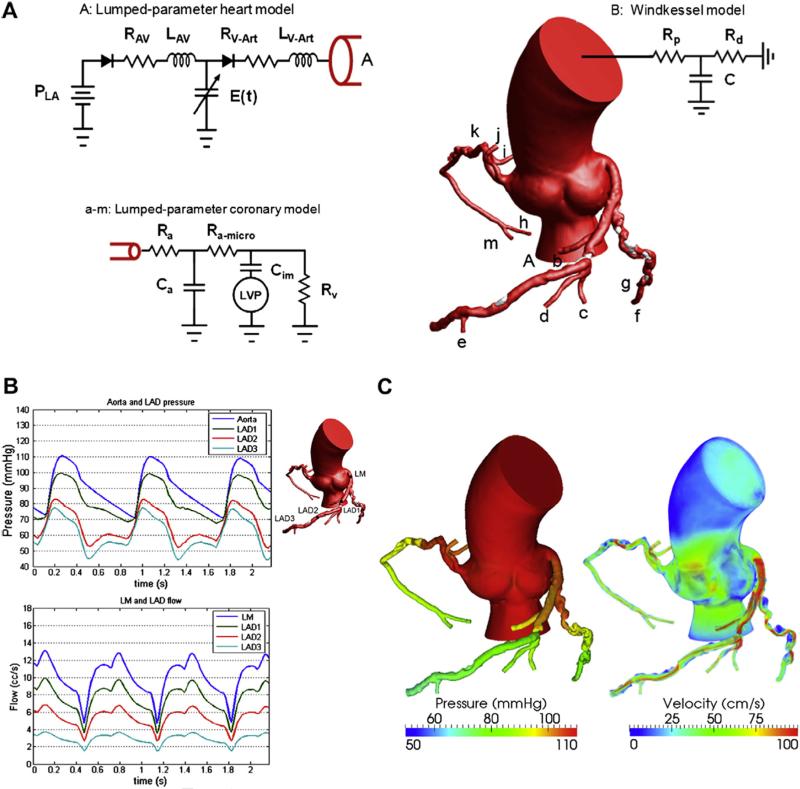
A mathematical model for pulsatile coronary flow. (A) Lumped parameter models are coupled to the aortic inlet and noncoronary vasculature and coronary microcirculation. P is the pressure, R the resistance, C the capacitance, L the inductance, and E(t) the elastance. Subscript LA is for the left atrium, AV for atrioventricular, V-Art for ventricle-arterial, p for proximal, d for distal, a for arterial, im for intermyocardial, and V for venous. (B) Pulsatile pressure and flow rate waveforms demonstrate reduced coronary flow in early systole because of contraction of the ventricle followed by increased flow in diastole, resulting from relaxation of the ventricle. (C) Velocity fields and 3-dimensional pressure are computed throughout the cardiac cycle. The pressure gradients and high-velocity jets across stenoses in the left anterior descending artery (LAD), left circumflex artery (LCX), and right coronary artery (RCA) can be noted. (Color version of figure is available online.)
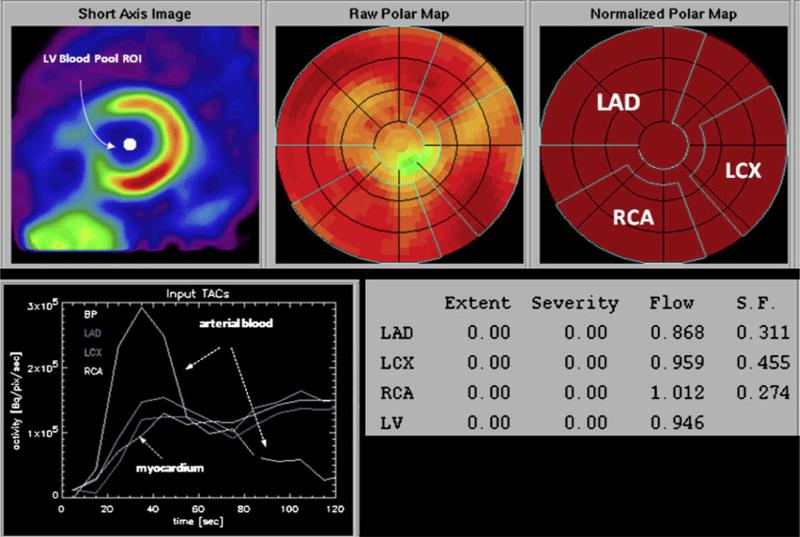
Determination of regional myocardial blood flow from the serially acquired PET images. On the reoriented short-axis image of the left ventricular myocardium (upper left panel), a region of interest is assigned to the left ventricular blood pool. The polar map displays the relative distribution of the flow tracer throughout the left ventricular myocardium. Based on a comparison with a normal database, no regional reductions in radiotracer activity are identified. Regions of interest are assigned to the territories of the left anterior descending (LAD), the left circumflex (LCX), and the right coronary arteries (RCAs). The corresponding time-activity curves for arterial blood and the myocardial regions are shown in the left lower panel. The final readout is shown in the lower left panel; extent and severity of regional flow defects are indicated but listed as zero because of the normal homogenous radiotracer distribution. Values of flow in mL/min/g are indicated for each of the vascular territories as well as the entire left ventricular myocardium. ROI, region of interest; S.F., spillover fraction, for cross contamination of activity from blood into myocardium. (Color version of figure is available online.)
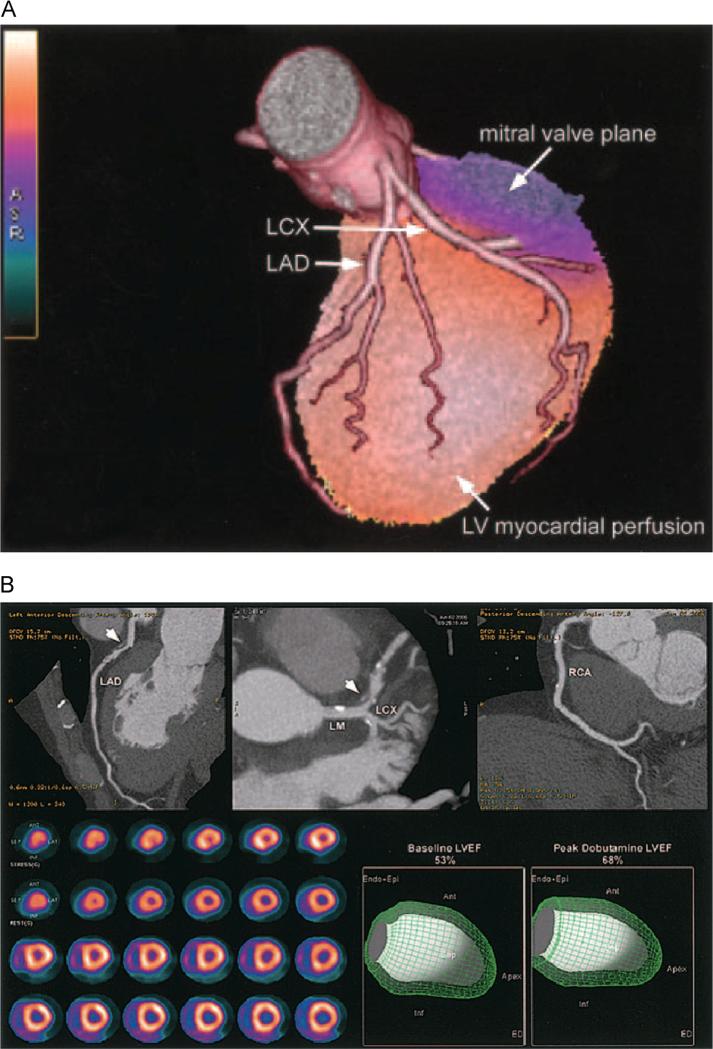
(A) Fused 3D reconstructions of a coronary arteriogram and stress myocardial perfusion obtained in the same setting, assessed through integrated PET/CT. A full-motion cine can be viewed in the online-only Data Supplement Movie V. LCX indicates left circumflex artery; LAD, left anterior descending coronary artery. (B) An integrated PET/CT study. The CTA images demonstrate a noncalcified plaque (arrowhead) in the proximal left anterior descending coronary artery (LAD) with 50%-70% stenosis; however, the rest and peak dobutamine stress myocardial perfusion PET study (lower left panel) demonstrates only minimal inferoapical ischemia. In addition, LVEF was normal at rest and demonstrated a normal rise during peak dobutamine stress. Full-motion cines can be viewed in the online-only Data Supplement (Movies VI and VII). Ant, anterior; Endo Epi, endocardial plus epicardial; Inf, inferior; LCX, left circumflex; LM, left main; RCA, right coronary artery.
References
-
- Murray CJL, Lopez AD. Alternative projections of mortality and disability by cause 1990-2020: Global Burden of Disease study. Lancet. 1997;349:1498–1504. - PubMed
-
- Who . World Health Statistics. World Health Organization; 2008. 2008.
-
- Budoff MJ, Dowe D, Jollis JG, et al. Diagnostic performance of 64-multidetector row coronary computed tomographic angiography for evaluation of coronary artery stenosis in individuals without known coronary artery diseaseresults from the prospective multicenter ACCURACY (assessment by coronary computed tomographic angiography of individuals undergoing invasive coronary angiography) Trial. J Am Coll Cardiol. 2008;52:1724–1732. - PubMed
-
- Miller JM, Rochitte CE, Dewey M, et al. Diagnostic performance of coronary angiography by 64-row CT. N Engl J Med. 2008;359:2324–2336. - PubMed
Publication types
MeSH terms
Grants and funding
LinkOut - more resources
Full Text Sources
Other Literature Sources
Medical
