. 2014 Dec:103:391-400.
doi: 10.1016/j.neuroimage.2014.09.010. Epub 2014 Sep 16.

RELICA: a method for estimating the reliability of independent components

Affiliations

RELICA: a method for estimating the reliability of independent components

Fiorenzo Artoni et al. Neuroimage. 2014 Dec.

Abstract

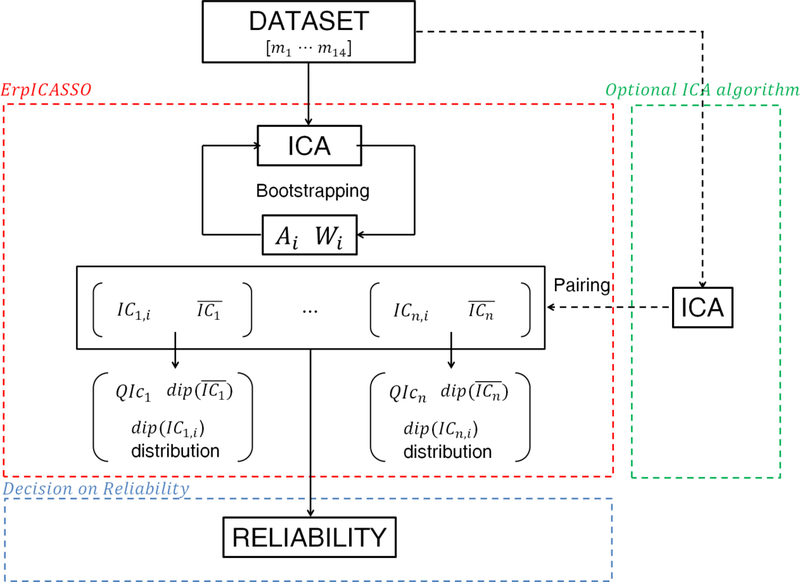
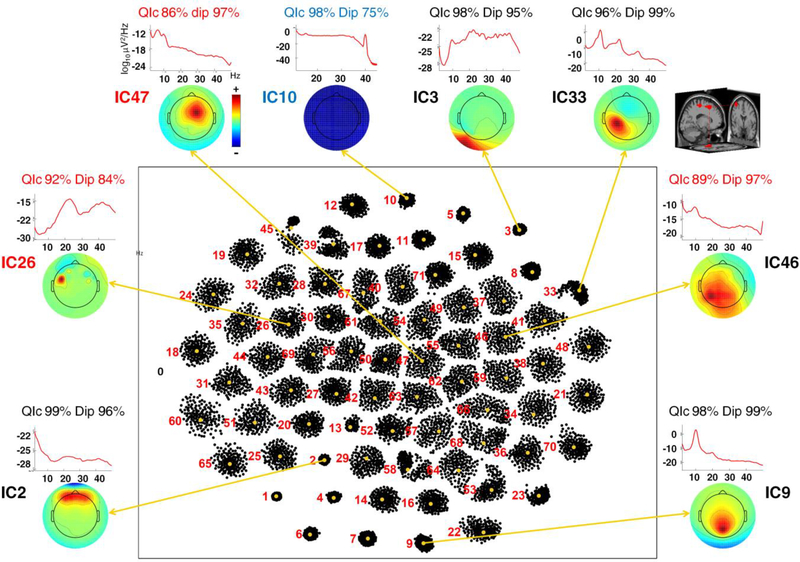
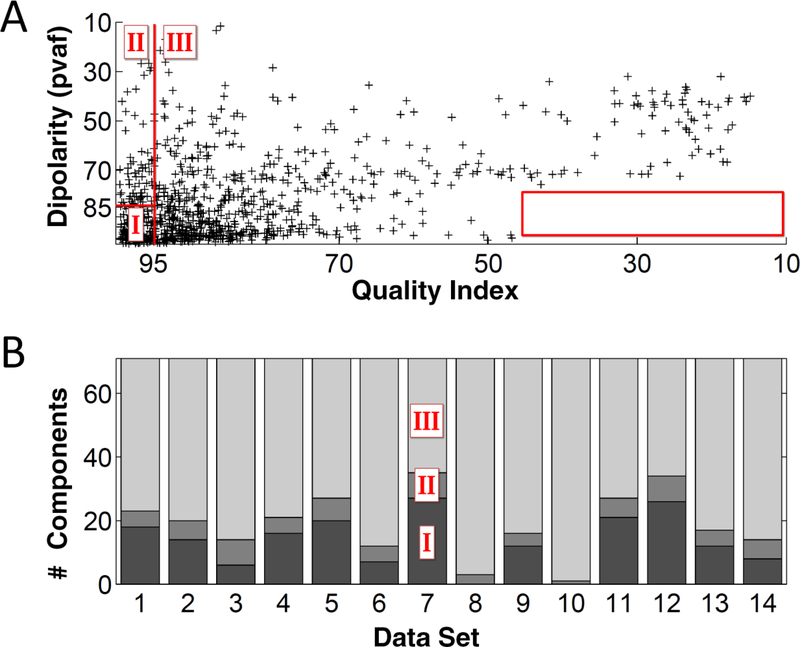
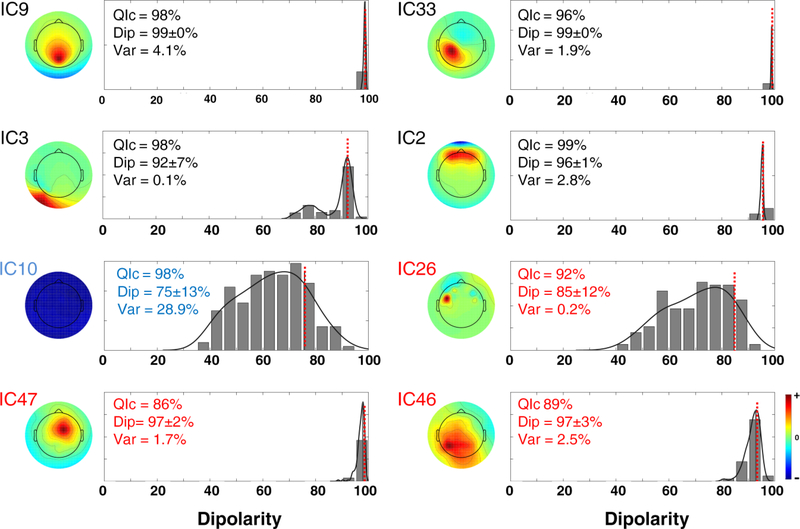
Independent Component Analysis (ICA) is a widely applied data-driven method for parsing brain and non-brain EEG source signals, mixed by volume conduction to the scalp electrodes, into a set of maximally temporally and often functionally independent components (ICs). Many ICs may be identified with a precise physiological or non-physiological origin. However, this process is hindered by partial instability in ICA results that can arise from noise in the data. Here we propose RELICA (RELiable ICA), a novel method to characterize IC reliability within subjects. RELICA first computes IC "dipolarity" a measure of physiological plausibility, plus a measure of IC consistency across multiple decompositions of bootstrap versions of the input data. RELICA then uses these two measures to visualize and cluster the separated ICs, providing a within-subject measure of IC reliability that does not involve checking for its occurrence across subjects. We demonstrate the use of RELICA on EEG data recorded from 14 subjects performing a working memory experiment and show that many brain and ocular artifact ICs are correctly classified as "stable" (highly repeatable across decompositions of bootstrapped versions of the input data). Many stable ICs appear to originate in the brain, while other stable ICs account for identifiable non-brain processes such as line noise. RELICA might be used with any linear blind source separation algorithm to reduce the risk of basing conclusions on unstable or physiologically un-interpretable component processes.

Keywords: Bootstrap; EEG; FastICA; ICA; ICASSO; Independent Component Analysis; Infomax; RELICA; Reliability.


Figures

Figure 1
Figure 1
A schematic of the RELICA method to test the reliability of independent component (IC) processes separated from EEG data sets. The data set is first decomposed using an ErpICASSO approach (red box); for each resulting IC cluster a reliability decision is made (blue box). Within ErpICASSO, the ICA decomposition is performed n times, each time yielding a matrix Ai and Wi. ICs are clustered according to their similarities, and one IC (ICn¯) is extracted from each cluster. Then the IC dipolarity, dip(IC¯n), QIc and dip(ICn,i) distributions are computed. Based on those values, it is possible to decide on the reliability of a component. For multi-subject experiments, it is possible to add measures of between-subject stability of components as in the ICA data analysis approach now embodied in EEGLAB. (The green box and dotted line represent an optional step that could be added to RELICA, as explained in the Discussion).
Figure 2
Figure 2
Results of ErpICASSO decomposition applied to a representative data set. Red numbers label the extracted ICs. No dimensionality reduction was performed; n equals the number of EEG channels, here 71. Each dot represents an IC produced by a bootstrap ICA decomposition, projected using CCA on a two-dimensional space with arbitrary units. The (IC) dots are clustered; the centroid is highlighted in orange. The smaller and more definite the cluster, the higher the quality index QIc (e.g., 99 % for cluster IC2). A few select examples are singled out and their centroid scalp maps are shown outside the main box along with their Power Spectral Densities (PSDs), QIc, and dipolarity values. A sample representation of the equivalent dipole model for the cluster IC33 exemplar in template brain 3-D space (IC9) is shown on the right. The labels are colored according to the three classes detailed in the Methods section: Class I, black (high QIc, high dipolarity); Class II, blue (high QIc, low dipolarity); Class III, red (low QIc). The bootstrap IC clusters shown account respectively for line noise (10), blink-related activity (2), neck EMG activity (3), posterior alpha activity (9), central mu rhythm activity (33), frontal activity (47) and parietal activity (46).
Figure 3
Figure 3
Panel A presents a scatterplot of dipolarity versus quality index values for the IC clusters of all the bootstrap data sets. The red lines (85% and 95% thresholds respectively for dipolarity and quality index) divide the IC dipolarity and quality space into the three Classes identified in the Methods section. The box on the right corner of the panel shows a “forbidden region” (range 0–45% and 75–100% for dipolarity), suggesting that high dipolar components cannot have extremely low QIc. Panel B shows for each data set (1 to 14) the number of ICs in each class.
Figure 4
Figure 4
Centroid scalp maps and distribution of dip(ICn) of eight select bootstrap IC clusters extracted from a representative data set. A fit of the distribution of dip(ICn) was computed using kernel density estimation (black curve), and the value of dip(IC¯n) is marked by a dotted red line. Each panel indicates the quality index QIc (which measures the variability of the ICA decomposition, from 0% – max. variability to 100% – min. variability), the dipolarity and standard deviation, and variance explained of each bootstrap component cluster. The titles are colored according to the IC classes as defined in Figure 2 and in the Methods section.

References

    1. Cardoso JF, “Blind signal separation: Statistical principles,” Proceedings of the IEEE, vol. 86, pp. 2009–2025, 1998.
    1. Nunez PL, “Electric Fields of the brain: the neurophysics of EEG. (Oxford, UK: Oxford University Press; ),” 1981.
    1. Makeig S, Debener S, Onton J, and Delorme A, “Mining event-related brain dynamics,” Trends Cogn Sci, vol. 8, pp. 204–10, May 2004. - PubMed
    1. Onton J, Westerfield M, Townsend J, and Makeig S, “Imaging human EEG dynamics using independent component analysis,” Neurosci Biobehav Rev, vol. 30, pp. 808–22, 2006. - PubMed
    1. Hyvarinen A and Oja E, “Independent component analysis: algorithms and applications,” Neural Netw, vol. 13, pp. 411–30, May-Jun 2000. - PubMed