Clinical Trial
. 2014 Nov;134(5):1114-24.
doi: 10.1016/j.jaci.2014.07.026. Epub 2014 Sep 15.

Histologic eosinophilic gastritis is a systemic disorder associated with blood and extragastric eosinophilia, TH2 immunity, and a unique gastric transcriptome

Affiliations
Clinical Trial

Histologic eosinophilic gastritis is a systemic disorder associated with blood and extragastric eosinophilia, TH2 immunity, and a unique gastric transcriptome

Julie M Caldwell et al. J Allergy Clin Immunol. 2014 Nov.

Abstract

Background: The definition of eosinophilic gastritis (EG) is currently limited to histologic EG based on the tissue eosinophil count.

Objective: We aimed to provide additional fundamental information about the molecular, histopathologic, and clinical characteristics of EG.

Methods: Genome-wide transcript profiles and histologic features of gastric biopsy specimens, as well as blood eosinophil counts, were analyzed in patients with EG and control subjects (n = 15 each).

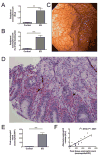
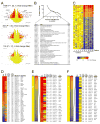
Results: The peak gastric antrum eosinophil count was 283 ± 164 eosinophils/×400 high-power field in patients with EG and 11 ± 9 eosinophils/×400 high-power field in control subjects (P = 6.1 × 10(-7)). Patients with EG (87%) had coexisting eosinophilic inflammation in multiple gastrointestinal segments; the esophagus represented the most common secondary site. Increased peripheral blood eosinophil counts (patients with EG: 1.09 ± 0.88 × 10(3)/μL vs control subjects: 0.09 ± 0.08 10(3)/μL, P = .0027) positively correlated with peak gastric eosinophil counts (Pearson r(2) = .8102, P < .0001). MIB-1(+) (proliferating), CD117(+) (mast cells), and FOXP3(+) (regulatory T cells, activated T cells, or both) cell counts were increased in patients with EG. Transcript profiling revealed changes in 8% of the genome in gastric tissue from patients with EG. Only 7% of this EG transcriptome overlapped with the eosinophilic esophagitis transcriptome. Significantly increased IL4, IL5, IL13, IL17, CCL26, and mast cell-specific transcripts and decreased IL33 transcripts were observed.

Conclusion: EG is a systemic disorder involving profound blood and gastrointestinal tract eosinophilia, TH2 immunity, and a conserved gastric transcriptome markedly distinct from the eosinophilic esophagitis transcriptome. The data herein define germane cellular and molecular pathways of EG and provide a basis for improving diagnosis and treatment.

Keywords: CCL26; EG transcriptome; Eosinophilic gastritis; IL-13; eosinophils; mast cells; regulatory T cells.


Figures

FIG 1
FIG 1
Gastric tissue of patients with eosinophilic gastritis (EG) displays marked eosinophilic inflammation that correlates with peripheral blood eosinophil counts. (A) Peripheral eosinophil count (K/μl) and (B) percentage of eosinophils within peripheral blood leukocytes (control, n = 9; EG, n = 15). (C) Example of gastric nodules in an EG patient. (D) H&E-stained gastric antrum biopsy specimen of an EG patient (Patient 19; magnification = 200X). Eosinophils densely populate the lamina propria forming sheets (arrows). (E) Peak gastric antrum tissue eosinophil counts (control, n = 15; EG, n = 15). (F) Peak gastric tissue eosinophil count was correlated with the absolute peripheral eosinophil number (K/μL) (Patients 1–30, if available [n = 9 control, n = 15 EG]). Pearson r2 = .8102, P < .0001. For (A–B) and (E), data are expressed as mean ± standard error of the mean (SEM) and were analyzed using the unpaired t test. **P < .01, ***P < .001. HPF, 400X high-power field; K, x1000.
FIG 2
FIG 2
Eosinophilic gastritis (EG) patient gastric tissue exhibits increased levels of proliferating cells and FOXP3+ cells. (A–D) Gastric antrum sections obtained during the index endoscopy (Patients 1–5 and 16–20; defined in Table E1) were stained with antibodies against the indicated protein. Representative photograph (magnification = 200X) of (A–B) MIB-1-stained and (C–D) FOXP3-stained gastric tissue from control and EG patients.
FIG 3
FIG 3
Gastric tissue of eosinophilic gastritis (EG) patients exhibits a conserved pattern of gene expression. (A) Microarray data (Patients 1–5 [control] and 16–20 [EG]) were analyzed by volcano plot. Transcripts of interest are denoted (top panel). (B) The number of transcripts that exhibit the indicated minimum fold difference in EG versus control patients is graphed. Transcripts (n = 32) with ≥5-fold change (i.e. ≥5 or ≤.2) are listed. (C) Expression values for individual patients (n = 104 transcripts; P < .01 and ≥2-fold change). Patient numbers correspond to those in Table E1. (D) The 41 transcripts common to the EG transcriptome (1709 transcripts) and the eosinophilic esophagitis (EoE) transcriptome are shown. (E–F) The 30 most (E) upregulated and (F) downregulated transcripts in the EG transcriptome are listed along with the corresponding relative fold change in expression in EoE vs. control tissue. Affy probe ID, Affymetrix probeset ID number; CTL, control.
FIG 4
FIG 4
Gastric tissue of eosinophilic gastritis (EG) patients exhibits a conserved pattern of cytokine gene expression. (A–D) Relative gastric antrum cytokine transcript levels (mean ± standard error of the mean [SEM]) ((A) IL4, (B) IL5, (C) IL17, and (D) IL33) were determined for Patients 6–15 (control) and 21–30 (EG). *P < .05, **P < .01, ***P < .001.
FIG 5
FIG 5
IL13 and CCL26 are elevated in eosinophilic gastritis (EG) patient gastric tissue. (A–B) Relative gastric antrum transcript levels (mean ± SEM) of (A) IL13 (Patients 1–5 [control] and 16–20 [EG]) and (B) CCL26 (Patients 6–15 [control] and 21–30 [EG]). (C) Normalized CCL26 transcript levels were correlated with normalized IL13 levels (Patients 6–15 [control] and 21–30 [EG]). (D–E) Normalized CCL26 transcript levels (Patients 1–5 [control] and 16–20 [EG]) were correlated with (D) average gastric tissue eosinophil count and (E) peak gastric tissue eosinophil count. For (C–E), Pearson r2 and P values are in bold; Spearman r and P values are in italics. *P < .05, ***P < .001. HPF, 400X high-power field; NS, not significant.

References

    1. Rothenberg ME. Eosinophilic gastrointestinal disorders (EGID) J Allergy Clin Immunol. 2004;113:11–28. quiz 9. - PubMed
    1. Talley NJ, Shorter RG, Phillips SF, Zinsmeister AR. Eosinophilic gastroenteritis: a clinicopathological study of patients with disease of the mucosa, muscle layer, and subserosal tissues. Gut. 1990;31:54–8. - PMC - PubMed
    1. Straumann A. Idiopathic eosinophilic gastrointestinal diseases in adults. Best Pract Res Clin Gastroenterol. 2008;22:481–96. - PubMed
    1. Danese S, Fiocchi C. Etiopathogenesis of inflammatory bowel diseases. World J Gastroenterol. 2006;12:4807–12. - PMC - PubMed
    1. Valent P, Klion AD, Horny HP, Roufosse F, Gotlib J, Weller PF, et al. Contemporary consensus proposal on criteria and classification of eosinophilic disorders and related syndromes. J Allergy Clin Immunol. 2012;130:607–12. e9. - PMC - PubMed

Publication types

MeSH terms

Supplementary concepts