. 2014 Sep 19:5:4913.
doi: 10.1038/ncomms5913.

Vibrio cholerae use pili and flagella synergistically to effect motility switching and conditional surface attachment

Affiliations

Vibrio cholerae use pili and flagella synergistically to effect motility switching and conditional surface attachment

Andrew S Utada et al. Nat Commun. .

Abstract

We show that Vibrio cholerae, the causative agent of cholera, use their flagella and mannose-sensitive hemagglutinin (MSHA) type IV pili synergistically to switch between two complementary motility states that together facilitate surface selection and attachment. Flagellar rotation counter-rotates the cell body, causing MSHA pili to have periodic mechanical contact with the surface for surface-skimming cells. Using tracking algorithms at 5 ms resolution we observe two motility behaviours: 'roaming', characterized by meandering trajectories, and 'orbiting', characterized by repetitive high-curvature orbits. We develop a hydrodynamic model showing that these phenotypes result from a nonlinear relationship between trajectory shape and frictional forces between pili and the surface: strong pili-surface interactions generate orbiting motion, increasing the local bacterial loiter time. Time-lapse imaging reveals how only orbiting mode cells can attach irreversibly and form microcolonies. These observations suggest that MSHA pili are crucial for surface selection, irreversible attachment, and ultimately microcolony formation.


Figures

FIG. 1
FIG. 1
Near-surface trajectories generated by cell tracking and analysis. (a) WT trajectories extracted from a high-speed movie of 100 s at 5 ms resolution during the first 5 min after inoculation. Different tracks are represented by different colours. The scale bars represent 10 μm and applies to (a-e). (b) Binary image of stationary, surface-adherent cells at the end the 100 s movie. (inset) Bright-field image of a V. cholerae cell. The scale bar represents 1 μm. (c) Subset of the population in (a) filtered for cells exhibiting orbiting motility. (d) Subset of the population in (a) filtered for cells exhibiting roaming motility. (e) ΔmshA mutant trajectories extracted from a high-speed movie of 100 s at 5 ms resolution during the first 5 min after inoculation. (e, lower) Lower half of the same field of view showing only a subset of all cells to enable better visualisation. (f) Number of surface-adhered cells as a function of time for WT (○) and ΔmshA (△) with same initial cell number density. (g) Histogram of Rgyr for all WT tracks in (a) (N = 3315). The (red) line is a fit to a normal distribution centred at 2.6 μm. (inset) Expanded view of the fraction of Rgyr > 10 μm. (h) MSD versus time for representative WT orbiting (○) and roaming cells (□). The red line is a model fit to the MSD of the orbiting cell. Average MSD of all ΔmshA mutants (Δ) (NΔmshA = 2030) and ΔflaA mutants (△) (NΔflaA = 6). Error bars represent one SD. The numbers represent the slopes of the two lines.
FIG. 2
FIG. 2
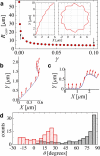
Histogram of the trajectory-averaged angular difference (〈θ〉) between the direction of motion and the cell-body axis. (Upper) Unfilled bars: all mobile WT cells. Grey bars: subset of WT exhibiting orbiting motility. Red bars: subset of WT exhibiting roaming motility. (Lower) ΔmshA mutants. (NWT = 1877, NΔmshA = 2030). (inset) Schematic showing how θ is defined.
FIG. 3
FIG. 3
Modelled orbital and roaming cell trajectories. (a) Model derived average radius of curvature (Rcurv) as a function of the friction coefficient γ. The arrows indicate two different γ values used to model roaming and orbiting pheno-types: γ = 0.002 and 0.1, respectively. (inset, left) Modelled roaming trajectory for 10 cycles; here, Rcurv = 38 μm. (inset, right) Modelled orbiting trajectory for 20 cycles; here Rcurv = 7 μm. (b) Magnification of one cycle of the roaming trajectory (from Fig. 3a). (c) Magnification of one cycle of the orbiting trajectory (from Fig. 3a). Arrows indicate the direction of the body axis at discrete points along the track. (d) Histogram of the instantaneous θ for roaming (hatched) and orbiting (filled) over one cycle.
FIG. 4
FIG. 4
Representative roaming (a, left) and orbiting (a, right) surface motility trajectories. (b) Speed and (c) θ heat maps of the boxed section of the roaming trajectory in a. (d) Speed and (e) θ heat maps of the boxed section of the orbital trajectory in a.
FIG. 5
FIG. 5
(a) Histogram of pause durations (tpause) for: (Upper) WT orbiting motility mode (grey bars) and roaming motility mode (red hatched bars). (Norbiting = 9466 and Nroaming = 391); (Middle) ΔmshA mutants (N = 1521); (Lower) WT incubated in 200 mM dMann (NdMann = 5068). (b) False colour image of surface-attached cells 1 hr after inoculation. Cells that orbited prior to attachment are shown in light green. Dark green cells attached within the first hour after inoculation, between high-speed movie bursts. The red cells (circled) depart during the subsequent 7 hr time-lapse sequence. (c) False colour image of the same field of view 7 hr later. We overlay the green cells on the microcolonies to show their origin. Colonies outlined in red were initiated from the bulk during the time-lapse.

References

    1. Colwell RR, Huq A. Environmental reservoir of Vibrio cholerae. The causative agent of cholera. Ann. N. Y. Acad. Sci. 1994;740:44–54. - PubMed
    1. Faruque SM, Albert MJ, Mekalanos JJ. Epidemiology, Genetics, and Ecology of Toxigenic Vibrio cholerae. Microbiol. Mol. Biol. Rev. 1998;62:1301–1314. - PMC - PubMed
    1. Faruque SM, et al. Transmissibility of cholera: in vivo-formed biofilms and their relationship to infectivity and persistence in the environment. Proc. Natl. Acad. Sci. 2006;103:6350–6355. - PMC - PubMed
    1. Lipp EK, Huq A, Colwell RR. Effects of Global Climate on Infectious Disease: the Cholera Model. Clin. Microbiol. Rev. 2002;15:757–770. - PMC - PubMed
    1. Yildiz FH, Schoolnik GK. Vibrio cholerae O1 El Tor: identification of a gene cluster required for the rugose colony type, exopolysaccharide production, chlorine resistance, and biofilm formation. Proc. Natl. Acad. Sci. 1999;96:4028–4033. - PMC - PubMed

Publication types

LinkOut - more resources