. 2014 Sep;198(1):17-29.
doi: 10.1534/genetics.114.162982.

Identification of a novel gene for diabetic traits in rats, mice, and humans

Affiliations

Identification of a novel gene for diabetic traits in rats, mice, and humans

Shirng-Wern Tsaih et al. Genetics. 2014 Sep.

Abstract

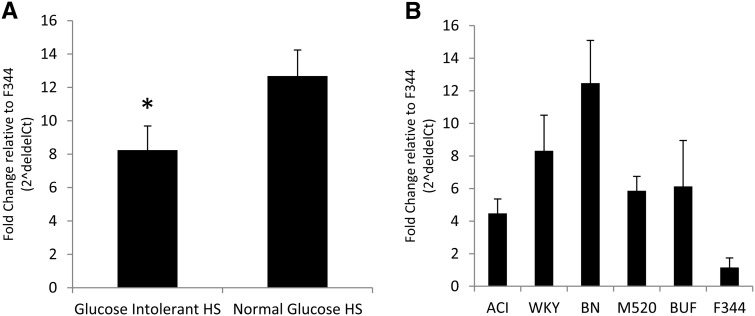
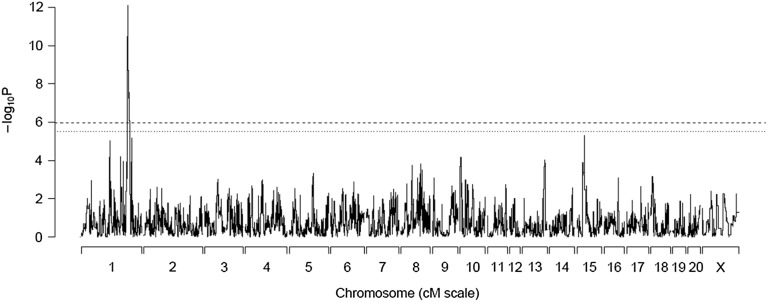
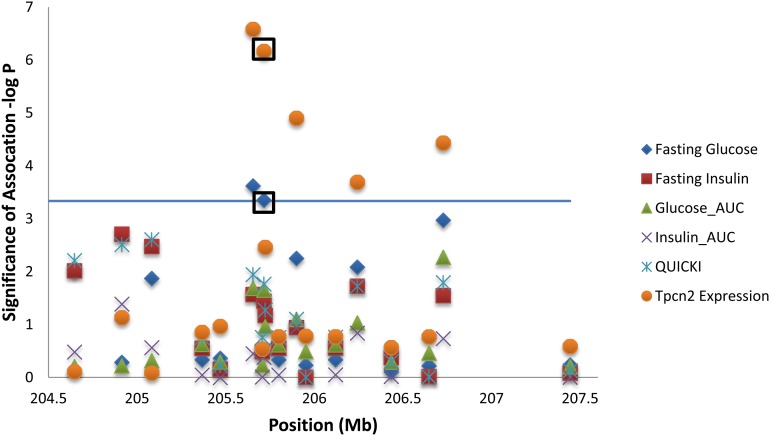
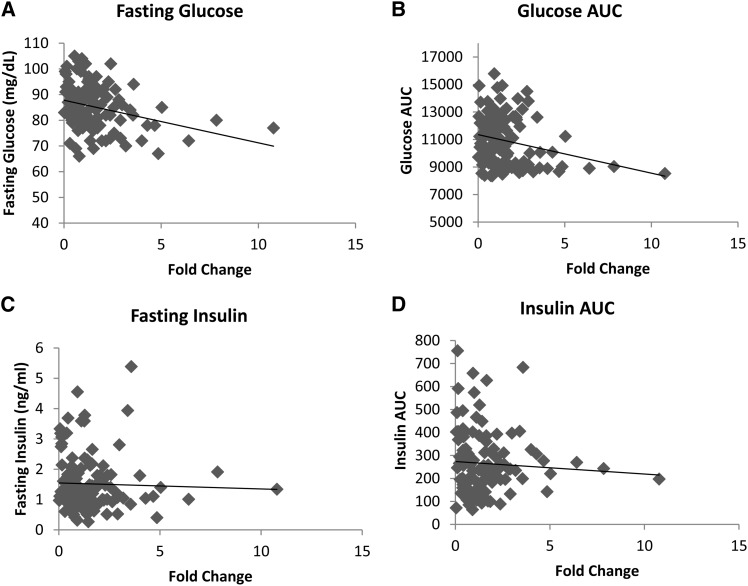
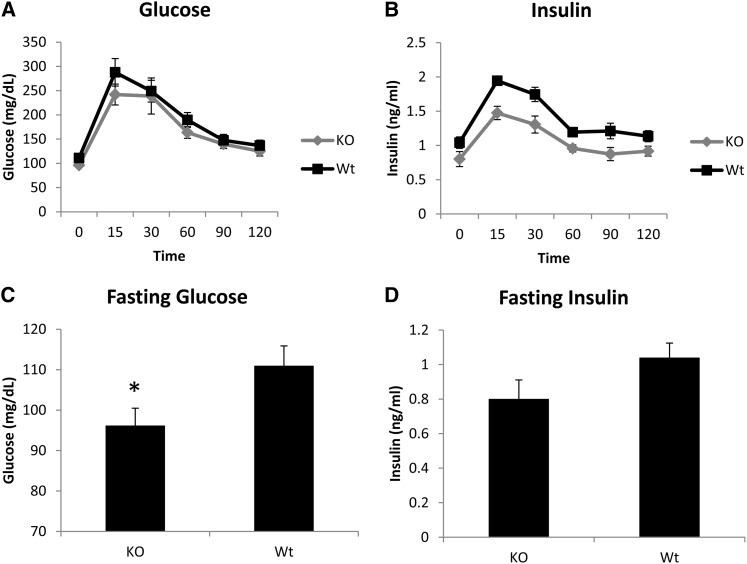
The genetic basis of type 2 diabetes remains incompletely defined despite the use of multiple genetic strategies. Multiparental populations such as heterogeneous stocks (HS) facilitate gene discovery by allowing fine mapping to only a few megabases, significantly decreasing the number of potential candidate genes compared to traditional mapping strategies. In the present work, we employed expression and sequence analysis in HS rats (Rattus norvegicus) to identify Tpcn2 as a likely causal gene underlying a 3.1-Mb locus for glucose and insulin levels. Global gene expression analysis on liver identified Tpcn2 as the only gene in the region that is differentially expressed between HS rats with glucose intolerance and those with normal glucose regulation. Tpcn2 also maps as a cis-regulating expression QTL and is negatively correlated with fasting glucose levels. We used founder sequence to identify variants within this region and assessed association between 18 variants and diabetic traits by conducting a mixed-model analysis, accounting for the complex family structure of the HS. We found that two variants were significantly associated with fasting glucose levels, including a nonsynonymous coding variant within Tpcn2. Studies in Tpcn2 knockout mice demonstrated a significant decrease in fasting glucose levels and insulin response to a glucose challenge relative to those in wild-type mice. Finally, we identified variants within Tpcn2 that are associated with fasting insulin in humans. These studies indicate that Tpcn2 is a likely causal gene that may play a role in human diabetes and demonstrate the utility of multiparental populations for positionally cloning genes within complex loci.

Keywords: MPP; Multiparent Advanced Generation Inter-Cross (MAGIC); Multiparental populations; Tpcn2; expression QTL mapping; glucose; heterogeneous stock rats; insulin; type 2 diabetes.


Figures

Figure 1
Figure 1
(A and B) Cluster analysis of (A) glucose and (B) insulin levels during an intraperitoneal glucose tolerance test in >500 HS rats. Values are expressed in means ± SE. We identified six clusters based on glucose and insulin values. Because cluster 5 included only one animal, however, it is not included in the graphs or in subsequent analyses. Note that clusters with similar glucose values (clusters 1 and 6 or 3 and 4) have drastically different insulin values. Based on this cluster analysis, we selected animals for the expression analysis, choosing glucose intolerant HS from cluster 1 and HS with normal glucose from clusters 2 and 4.
Figure 2
Figure 2
(A and B) Differential expression of Tpcn2 by qRT-PCR in (A) HS rats and (B) HS founder substrains. Bars show the mean ± SE. Glucose intolerant HS rats exhibit an approximately twofold decrease in expression levels of Tpcn2 relative to HS rats with normal glucose levels (*P = 0.05). Large variation is seen in HS founder substrains with BN exhibiting the greatest levels of Tpcn2 and the F344 strain exhibiting the least. All fold-change differences are relative to the F344 founder strain. Note that the scales in A and B are the same.
Figure 3
Figure 3
Genome-wide eQTL scan of Tpcn2 expression levels using 10K SNP markers. The x-axis shows chromosome number and position in centimorgans. The y-axis gives the –log10 P-value of association. The dashed lines represent the genome-wide significance thresholds (bottom line represents the suggestive threshold at P = 0.1 and the top line represents significance at P = 0.05). Tpcn2 expression levels map to within 1 Mb of the gene itself on rat chromosome 1, indicating this gene is cis-regulated.
Figure 4
Figure 4
Association analysis between 18 SNPs within the 3.1-Mb QTL and all traits that map to this region, including five diabetic traits and Tpcn2 expression levels. A mixed model, which takes into account the complex family structure of the HS, was used. The nonsynonymous coding variant within Tpcn2, which is significant for both fasting glucose and Tpcn2 expression levels, has been marked with a black square. The x-axis shows the position in megabases, and the y-axis give the –log10 P of association. The solid line represents the Bonferroni-adjusted region-wide significance threshold (3.33). Expression levels are based on fold change from the qPCR data, n = 120 HS rats; for all other phenotypes, n = 508 HS rats.
Figure 5
Figure 5
(A–D) Expression of Tpcn2 in liver of 120 HS rats as determined by qRT-PCR and correlations with (A) fasting glucose, (B) glucose_AUC, (C) fasting insulin, and (D) QUICKI. Fold change is relative to the mean ct of all HS animals. The black line represents the best fit. A significant negative correlation is found between Tpcn2 expression levels and fasting glucose (r = −0.302, P = 0.001) and glucose_AUC (r = −0.246, P = 0.007). When the outliers are removed, fasting glucose remains significant (r = −0.232, P = 0.013).
Figure 6
Figure 6
(A–D) Glucose and insulin levels after a glucose tolerance test (A and B) and at fasting (C and D) in wild-type (WT) and Tpcn2 knockout (KO) mice. Knockout mice exhibit significantly lower fasting glucose levels (*P = 0.048). Although fasting insulin levels do not differ significantly between wild-type and knockout mice, insulin_AUC is highly significantly different (P = 0.031).

Similar articles

Cited by

References

    1. Aitman T. J., Dong R., Vyse T. J., Norsworthy P. J., Johnson M. D., et al. , 2006. Copy number polymorphism in Fcgr3 predisposes to glomerulonephritis in rats and humans. Nature 439(7078): 851–855 - PubMed
    1. Alejandro E. U., Kalynyak T. B., Taghizadeh F., Gwiazda K. S., Rawstron E. K., et al. , 2010. Acute insulin signaling in pancreatic beta-cells is mediated by multiple Raf-1 dependent pathways. Endocrinology 151(2): 502–512 - PMC - PubMed
    1. Arredouani A., Evans A. M., Ma J., Parrington J., Zhu M. X., et al. , 2010. An emerging role for NAADP-mediated Ca2+ signaling in the pancreatic beta-cell. Islets 2(5): 323–330 - PMC - PubMed
    1. Baud A., Hermsen R., Guryev V., Stridh P., Graham D., et al. , 2013. Combined sequence-based and genetic mapping analysis of complex traits in outbred rats. Nat. Genet. 45(7): 767–775 - PMC - PubMed
    1. Behmoaras J., Bhangal G., Smith J., McDonald K., Mutch B., et al. , 2008. Jund is a determinant of macrophage activation and is associated with glomerulonephritis susceptibility. Nat. Genet. 40(5): 553–559 - PMC - PubMed

Publication types