Neural correlates of strategic reasoning during competitive games
- PMID: 25236468
- PMCID: PMC4201877
- DOI: 10.1126/science.1256254
Neural correlates of strategic reasoning during competitive games
Abstract
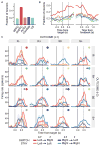
Although human and animal behaviors are largely shaped by reinforcement and punishment, choices in social settings are also influenced by information about the knowledge and experience of other decision-makers. During competitive games, monkeys increased their payoffs by systematically deviating from a simple heuristic learning algorithm and thereby countering the predictable exploitation by their computer opponent. Neurons in the dorsomedial prefrontal cortex (dmPFC) signaled the animal's recent choice and reward history that reflected the computer's exploitative strategy. The strength of switching signals in the dmPFC also correlated with the animal's tendency to deviate from the heuristic learning algorithm. Therefore, the dmPFC might provide control signals for overriding simple heuristic learning algorithms based on the inferred strategies of the opponent.
Copyright © 2014, American Association for the Advancement of Science.
Figures


Similar articles
-
Cortical mechanisms for reinforcement learning in competitive games.Philos Trans R Soc Lond B Biol Sci. 2008 Dec 12;363(1511):3845-57. doi: 10.1098/rstb.2008.0158. Philos Trans R Soc Lond B Biol Sci. 2008. PMID: 18829430 Free PMC article.
-
Reinforcement learning and decision making in monkeys during a competitive game.Brain Res Cogn Brain Res. 2004 Dec;22(1):45-58. doi: 10.1016/j.cogbrainres.2004.07.007. Brain Res Cogn Brain Res. 2004. PMID: 15561500
-
Prefrontal cortex and decision making in a mixed-strategy game.Nat Neurosci. 2004 Apr;7(4):404-10. doi: 10.1038/nn1209. Epub 2004 Mar 7. Nat Neurosci. 2004. PMID: 15004564
-
Valuation of uncertain and delayed rewards in primate prefrontal cortex.Neural Netw. 2009 Apr;22(3):294-304. doi: 10.1016/j.neunet.2009.03.010. Epub 2009 Mar 29. Neural Netw. 2009. PMID: 19375276 Free PMC article. Review.
-
Mechanisms of reinforcement learning and decision making in the primate dorsolateral prefrontal cortex.Ann N Y Acad Sci. 2007 May;1104:108-22. doi: 10.1196/annals.1390.007. Epub 2007 Mar 8. Ann N Y Acad Sci. 2007. PMID: 17347332 Review.
Cited by
-
Opponent Identity Influences Value Learning in Simple Games.J Neurosci. 2015 Aug 5;35(31):11133-43. doi: 10.1523/JNEUROSCI.3530-14.2015. J Neurosci. 2015. PMID: 26245974 Free PMC article.
-
Hierarchical decision processes that operate over distinct timescales underlie choice and changes in strategy.Proc Natl Acad Sci U S A. 2016 Aug 2;113(31):E4531-40. doi: 10.1073/pnas.1524685113. Epub 2016 Jul 18. Proc Natl Acad Sci U S A. 2016. PMID: 27432960 Free PMC article.
-
Learning at Variable Attentional Load Requires Cooperation of Working Memory, Meta-learning, and Attention-augmented Reinforcement Learning.J Cogn Neurosci. 2021 Dec 6;34(1):79-107. doi: 10.1162/jocn_a_01780. J Cogn Neurosci. 2021. PMID: 34813644 Free PMC article.
-
Therapeutic doses of ketamine acutely attenuate the aversive effect of losses during decision-making.Elife. 2024 May 3;12:RP87529. doi: 10.7554/eLife.87529. Elife. 2024. PMID: 38700991 Free PMC article.
-
From the field to the lab and back: neuroethology of primate social behavior.Curr Opin Neurobiol. 2021 Jun;68:76-83. doi: 10.1016/j.conb.2021.01.005. Epub 2021 Feb 7. Curr Opin Neurobiol. 2021. PMID: 33567386 Free PMC article. Review.
References
-
- Hastie T, Tibshirani R, Friedman J. The Elements of Statistical Learning. Springer; New York: 2001.
-
- Gigerenzer G, Brighton H. Homo heuristicus: why biased minds make better inferences. Top Cogn Sci. 2009;1:107–143. - PubMed
-
- Sutton RS, Barto AG. Reinforcement Learning: An Introduction. MIT Press; Cambridge, MA: 1998.
-
- Ito M, Doya K. Multiple representations and algorithms for reinforcement learning in the cortico-basal ganglia circuit. Curr Opin Neurobiol. 2011;21:368–373. - PubMed
Publication types
MeSH terms
Grants and funding
LinkOut - more resources
Full Text Sources
Other Literature Sources

