. 2015 Jan;25(1):129-41.
doi: 10.1101/gr.177543.114. Epub 2014 Sep 18.

Burkholderia pseudomallei sequencing identifies genomic clades with distinct recombination, accessory, and epigenetic profiles

Affiliations

Burkholderia pseudomallei sequencing identifies genomic clades with distinct recombination, accessory, and epigenetic profiles

Tannistha Nandi et al. Genome Res. 2015 Jan.

Erratum in

Abstract

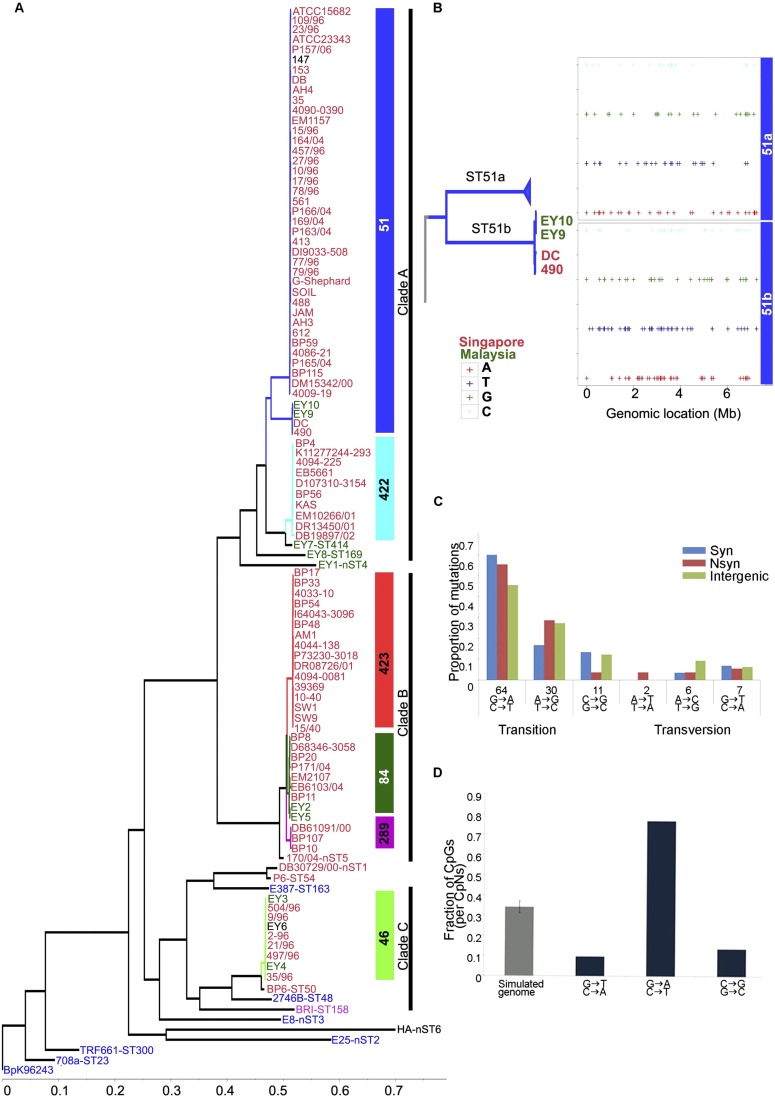
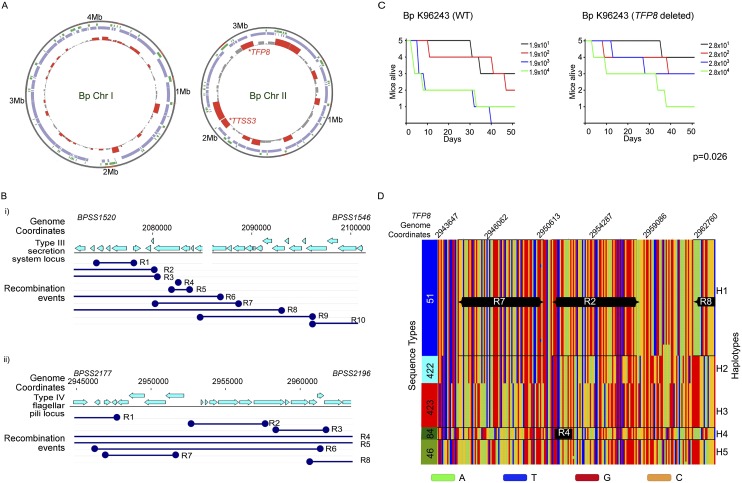
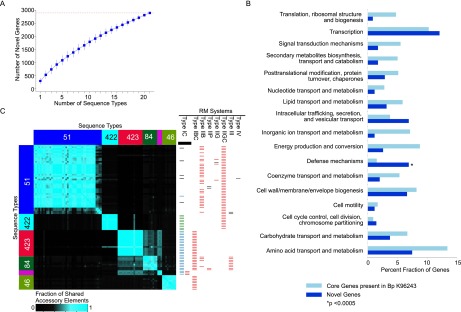
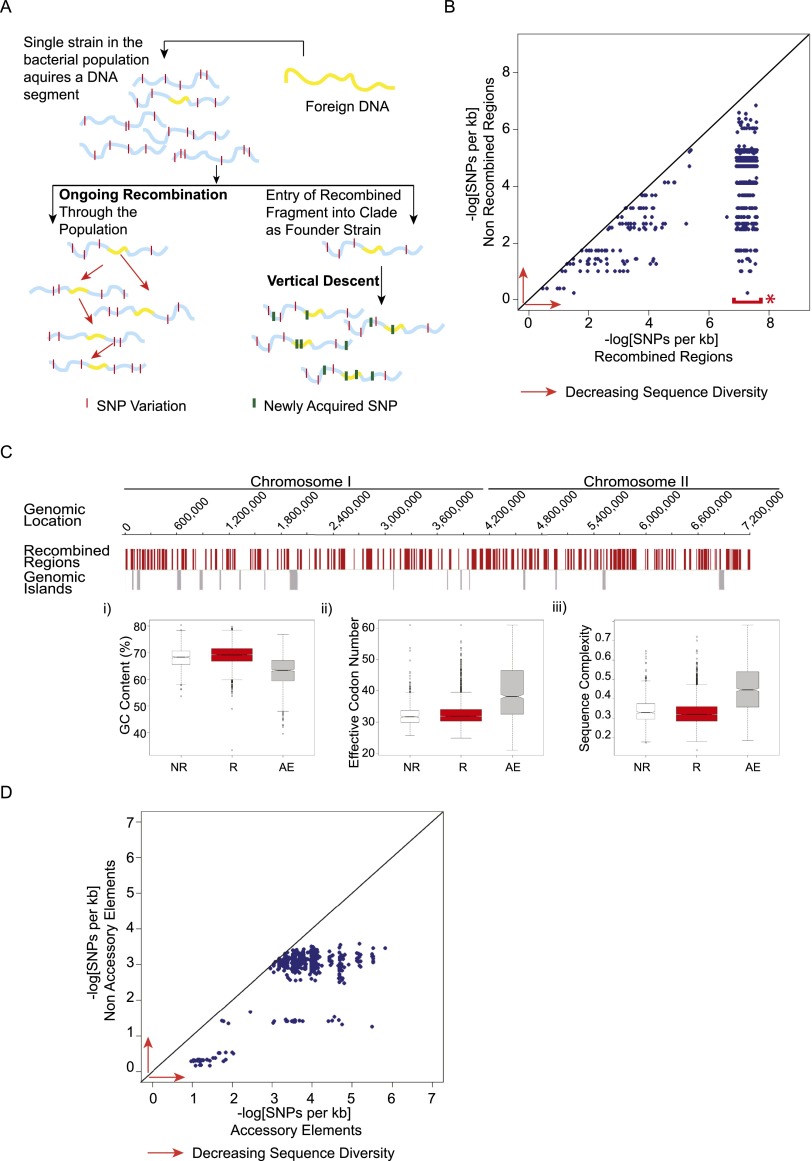
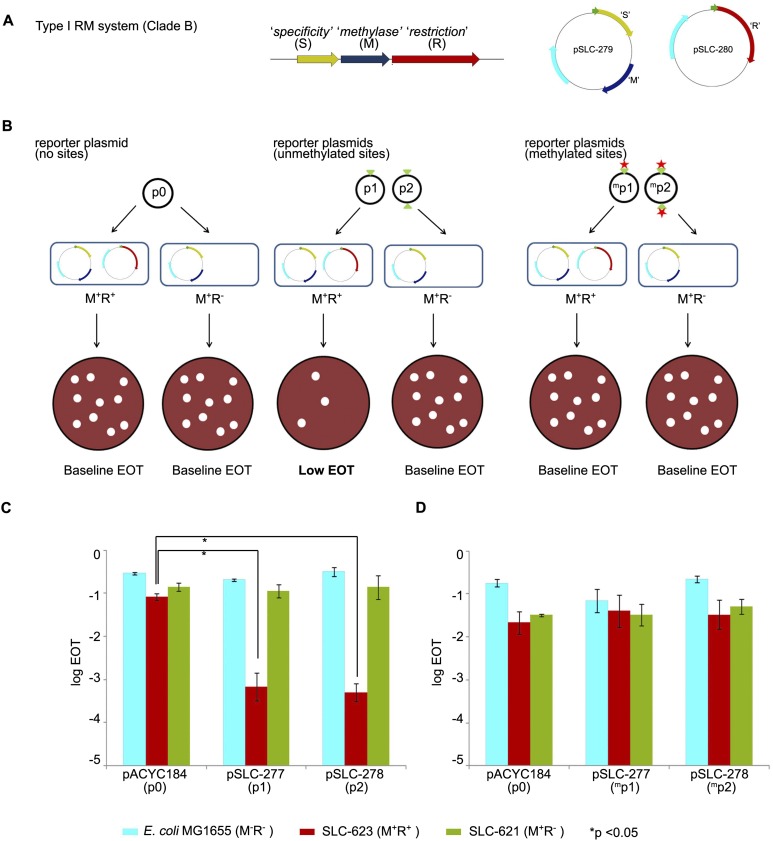
Burkholderia pseudomallei (Bp) is the causative agent of the infectious disease melioidosis. To investigate population diversity, recombination, and horizontal gene transfer in closely related Bp isolates, we performed whole-genome sequencing (WGS) on 106 clinical, animal, and environmental strains from a restricted Asian locale. Whole-genome phylogenies resolved multiple genomic clades of Bp, largely congruent with multilocus sequence typing (MLST). We discovered widespread recombination in the Bp core genome, involving hundreds of regions associated with multiple haplotypes. Highly recombinant regions exhibited functional enrichments that may contribute to virulence. We observed clade-specific patterns of recombination and accessory gene exchange, and provide evidence that this is likely due to ongoing recombination between clade members. Reciprocally, interclade exchanges were rarely observed, suggesting mechanisms restricting gene flow between clades. Interrogation of accessory elements revealed that each clade harbored a distinct complement of restriction-modification (RM) systems, predicted to cause clade-specific patterns of DNA methylation. Using methylome sequencing, we confirmed that representative strains from separate clades indeed exhibit distinct methylation profiles. Finally, using an E. coli system, we demonstrate that Bp RM systems can inhibit uptake of non-self DNA. Our data suggest that RM systems borne on mobile elements, besides preventing foreign DNA invasion, may also contribute to limiting exchanges of genetic material between individuals of the same species. Genomic clades may thus represent functional units of genetic isolation in Bp, modulating intraspecies genetic diversity.


Figures

Figure 1.
Figure 1.
Whole-genome phylogeny and sequence variation of Bp strains. (A) Global phylogeny of Bp strains. The maximum likelihood tree was constructed using SNPs not associated with recombination events (see Results). Tip labels are colored according to the geographic locations of isolation ([red] Singapore; [green] Malaysia; [blue] Thailand; [black] unknown; [pink] imported to UK). Inset bars at right indicate the MLST scheme ([blue] ST51; [cyan] ST422; [red] ST423; [dark green] ST84; [pink] ST289; [light green] ST46). Three major genomic clades are identified: Clade A (ST51, ST422, ST414, ST169, nST4); Clade B (ST423, ST84, ST289, nST5); and Clade C (ST46, ST50). (B) Intra-ST subgroups resolved by WGS. ST51 strains cluster into two groups: ST51a and ST51b. Genomic locations of 342 L-SNPs (including both intra- and intergenic SNPs) distinguishing ST51a and ST51b are shown. The top and bottom panels with four rows show SNPs exclusively present in the two groups ST51a+ST51b and ST51aST51b+, respectively. (C) Mutation spectra of ST51a: relative rates of six possible mutation categories. The most common mutations are C/G → T/A transitions. (D) Fraction of the three classes of cytosine mutations occurring at CG dinucleotides in the Bp genome compared with the expected fraction based on the average of 100 simulated genomes of the same size and composition (gray).
Figure 2.
Figure 2.
Recombination landscape of Bp. (A) Recombination hotspots in Bp. Circles: (outside) genome coordinates; (middle) compositionally biased regions identified by Alien hunter (Vernikos and Parkhill 2006) (green) and Bp core genome (violet); (innermost) regions of elevated recombination (height of red bars). Note that recombination levels are higher on Chr II than Chr I. Location of the TFP8 and TTSS3 clusters are indicated. (B) Local recombination events in the Type III secretion system and Type IVB pilus cluster. (Top) Genomic coordinates and location of protein-coding genes; (dark blue) predicted recombination events (R1 to Rn, n = number of recombination events) observed in Bp strains belonging to genomic clades (ST group 46, 51, 84, 289, 422, and 423). The recombination boundaries are indicated by the dark blue circles and the boundaries that fall beyond the depicted locus are shown as open ended. (C) Relative virulence of TFP8 deletion mutant. Graphs show survival curves of BALB/c mice following intranasal challenge with varying dosages of Bp (left: K96243 wild-type; right: TFP8 deletion mutant, units are colony forming units, CFU). See Methods for infection assay details. The TFP8 deletion mutant is significantly less virulent compared to Bp K96243 parental controls (P = 0.026, Mantel-Haenszel log rank test). (D) Distinct haplotypes at the TFP8 genomic locus. Each row represents an individual Bp strain arranged according to genomic clade/ST (shown on left with color bars indicating ST51 [blue]; ST422 [cyan]; ST423 [red]; ST84 [dark green]; and ST46 [light green]). Across each row (strain), SNP positions are ordered by genomic coordinate (top numbers, Bp Chr II, genomic locus 2,935,860–2,976,718), and color-coded according to nucleotide identity (A→ green; T→ blue; C→ orange; and G→ red). The right y-axis “Haplotypes” refers to the specific linear combination of SNPs exhibited by individual strains. In some cases, haplotypes can be composed of a specific combination of smaller recombination regions (R). For example, Haplotype H1 is composed of recombination regions R2, R7, and R8. Haplotype alignments were generated using Clustal X (Larkin et al. 2007).
Figure 3.
Figure 3.
Accessory genome landscape of Bp. (A) Accumulation curves for Bp novel accessory genes (blue). Vertical bars represent standard deviation values based upon 100 randomized input orders of different Bp STs. The total number of accessory genes is indicated by the red dotted line. (B) Functional enrichment of Bp accessory genes. COG functional categories are indicated on the y-axis, and the percentage of genes in each COG category is shown on the x-axis. Dark blue columns represent novel accessory genes, and light blue columns indicate all Bp core genes with COG annotations. COG categories exhibiting a significant enrichment among the Bp accessory genes are highlighted by asterisks ([*] P < 0.0005, binomial test; after Bonferroni correction). The COG category “DNA replication, recombination and repair” was excluded as it was represented mainly by mobility genes, particularly transposases and integrases. (C) Distribution of accessory elements across Bp clades. The heatmap represents an all-pairwise strain comparison showing the degree of accessory element overlap between pairs of strains. Strains are arranged on the x- and y-axis according to their genomic clades and sequence types (ST51 [blue]; ST289 [pink]; ST422 [cyan]; ST423 [red]; ST84 [dark green]; and ST46 [light green]). The color scale bar at the bottom indicates the degree of accessory element sharing (more blue equates to increased sharing). The right-hand chart depicts the different types of restriction-modification (RM) systems associated with different clades. In each column, the RM systems are color-coded based on their encoded protein-coding sequences. In the first column, the bars in green and blue refer to two distinct sets of RM genes that belong to Type IC RM systems. Strain-specific RM systems are in black.
Figure 4.
Figure 4.
Distinguishing between ongoing recombination and vertical descent and in Bp. (A) Alternative models for clade-specific recombination haplotypes. (Left) In the “Ongoing Recombination” model, an imported fragment sweeps through the population via recombination, resulting in homogenization of the recombining fragment across strains. The recombining fragment should show lower levels of sequence diversity compared to nonimported regions. (Right) In the “Vertical Descent” model, an ancestral strain acquires a genomic fragment (yellow) from an external strain and subsequently transmits that fragment to all daughter strains in a clonal fashion. In this model, the imported fragment should accumulate new point mutations (green bars) at a similar rate to nonimported regions. (B) Within-clade sequence diversity of recombined regions compared to nonrecombined regions. Scatter plots comparing within-clade sequence diversity values of individual recombined regions (x-axis) to nonrecombined regions (y-axis) for the same strains in a given clade. Sequence diversity decreases in the direction of the red arrows (to right and upward). (*) Data points highlighted by the red bar correspond to recombined regions exhibiting 100% sequence identity. To visualize these points in a manner that captures both their density and extremely low sequence diversity, these were plotted within the x-axis range of 6.9–7.6 on a negative log scale. Sequence diversity is defined as the number of SNPs per kb. (C) Sequence features of nonrecombined regions (NR), recombined regions (R), and accessory elements (AE). (Top) Bp K96243 genomic tracks of Chr I and Chr II. Row 1: Genomic locations of recombined regions (red). Row 2: Genomic locations of 16 known Bp genomic islands (gray). (Bottom) Sequence feature comparison of genes in nonrecombined (white; NR), recombined (red; R), and accessory elements (gray; AE): (i) GC content (Puigbò et al. 2008); (ii) effective codon number (Puigbò et al. 2008); and (iii) sequence complexity (Pietrokovski et al. 1990). Each hourglass plot spans the 25th to 75th percentile (interquartile range [IQR]) of all genes in that category, with the bottleneck at the median. Horizontal tick marks show data ranges within 1.5 × IQR of the 25th and 75th percentiles. Open circles represent outliers outside this range. The width of the bottleneck (i.e., the length of the V-shaped notch) depicts the 95% confidence interval for the median. (D) Within-clade sequence diversity of accessory elements compared to nonaccessory elements. Accessory elements are defined as regions not present in the BpK96243 reference strain (see Methods). Scatter plots compare average sequence diversity values for individual accessory elements (x-axis) to corresponding nonaccessory elements (y-axis) for the same strain pairs in a given clade. Sequence diversity is defined as the number of SNPs per kb.
Figure 5.
Figure 5.
Restriction of non-self DNA by clade-specific Bp RM systems. (A) Molecular cloning of a Type I RM system specific to Bp genomic Clade A. The RM system comprises three genes: (R) “restriction,” (M) “methylase,” (S) “specificity.” Genes S (yellow) and M (blue) were cloned in plasmid pSLC-279 with kanamycin resistance (KmR) to give the M+ plasmid. Gene R (red) was cloned in plasmid pSLC-280 with ampicillin resistance (ApR) to give the R+ plasmid. Resistance genes are depicted in cyan. Green arrows represent the T5 promoter used to induce expression of the cloned genes. Plasmids are not drawn to scale. (B) Efficiency of transformation (EOT) assay. Reporter plasmids p0, p1, and p2 harbor zero, one, and two copies of the predicted Type I recognition site (5′-GTCATN5TGG-3′; indicated by green triangles). Plasmid p0 should not show any EOT changes because it does not contain Type I recognition sequences. Unmethylated plasmids p1 and p2, when transformed into M+R+ strains, should be recognized via their Type I sites and cleaved by the Type I restriction enzyme (registered as a drop in number of transformants). However, when transformed into M+R strains that express the methyltransferase alone, no EOT differences should be observed. In contrast, methylated p1 and p2 plasmids (obtained by passage through M+R strains; methylated sites indicated by red stars and superscript m), when transformed into M+R+ strains, should be recognized as “self” DNA by the Type I system and resist cleavage, resulting in minimal EOT changes. (C) EOT assay results using unmethylated plasmids. Host strains are MG1655 (MR, no RM system, cyan); SLC-623 (M+R+, complete RM system, red); and SLC-621 (M+R, methyltransferase only, green). Reporter plasmids are pACYC184 (p0, control plasmid); pSLC-277 (p1, 1 recognition site); and pSLC-278 (p2, 2 recognition sites). Significant differences in EOT are observed between control plasmid p0 and plasmids p1 and p2 when transformed into M+R+ strains (P < 0.01) but not in host E. coli or M+R strains. EOT in this study is the normalized number of CmR transformants obtained per unit amount of plasmid DNA. (D) EOT assay using methylated plasmids. Reporter plasmids were passaged through M+R strains prior to transformation, which is predicted to cause recognition site methylation. No significant EOT differences are observed across the strains. All experiments were performed in triplicate, and data are presented as mean and standard deviations. Data are presented as log10 values of EOT. Student’s t-test was used to test for significant differences.

References

    1. Albers CA, Lunter G, MacArthur DG, McVean G, Ouwehand WH, Durbin R. 2011. Dindel: accurate indel calls from short-read data. Genome Res 21: 961–973. - PMC - PubMed
    1. Boddey JA, Flegg CP, Day CJ, Beacham IR, Peak IR. 2006. Temperature-regulated microcolony formation by Burkholderia pseudomallei requires pilA and enhances association with cultured human cells. Infect Immun 74: 5374–5381. - PMC - PubMed
    1. Carver T, Harris SR, Berriman M, Parkhill J, McQuillan JA. 2012. Artemis: an integrated platform for visualization and analysis of high-throughput sequence-based experimental data. Bioinformatics 28: 464–469. - PMC - PubMed
    1. Casadevall A, Pirofski LA. 2007. Accidental virulence, cryptic pathogenesis, martians, lost hosts, and the pathogenicity of environmental microbes. Eukaryot Cell 6: 2169–2174. - PMC - PubMed
    1. Chaisson MJ, Tesler G. 2012. Mapping single molecule sequencing reads using basic local alignment with successive refinement (BLASR): application and theory. BMC Bioinformatics 13: 238. - PMC - PubMed

Publication types

MeSH terms

Associated data