. 2014 Nov 6;124(19):2964-72.
doi: 10.1182/blood-2014-06-578542. Epub 2014 Sep 18.

Autosomal-dominant B-cell deficiency with alopecia due to a mutation in NFKB2 that results in nonprocessable p100

Affiliations

Autosomal-dominant B-cell deficiency with alopecia due to a mutation in NFKB2 that results in nonprocessable p100

Cindy Eunhee Lee et al. Blood. .

Abstract

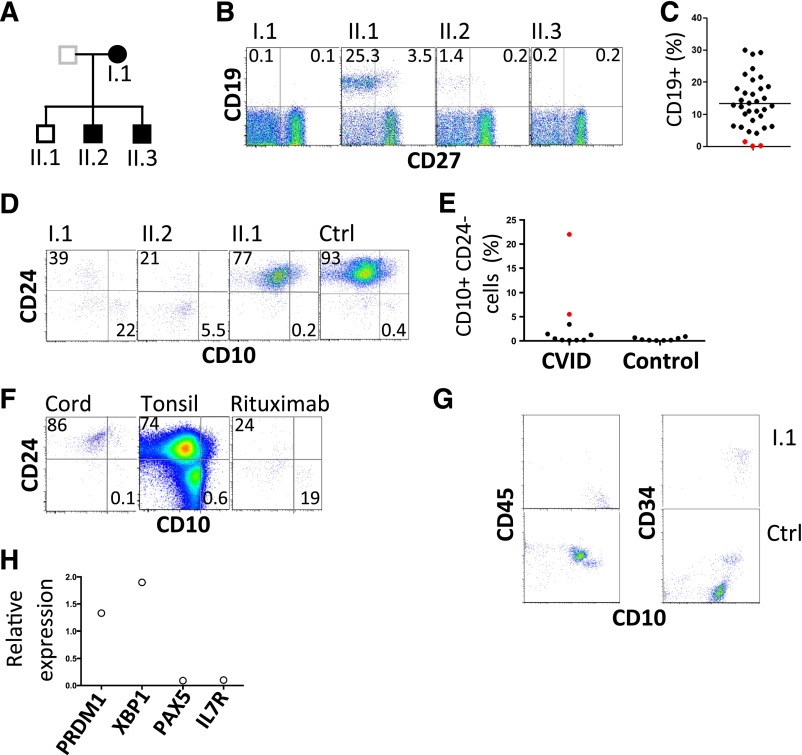
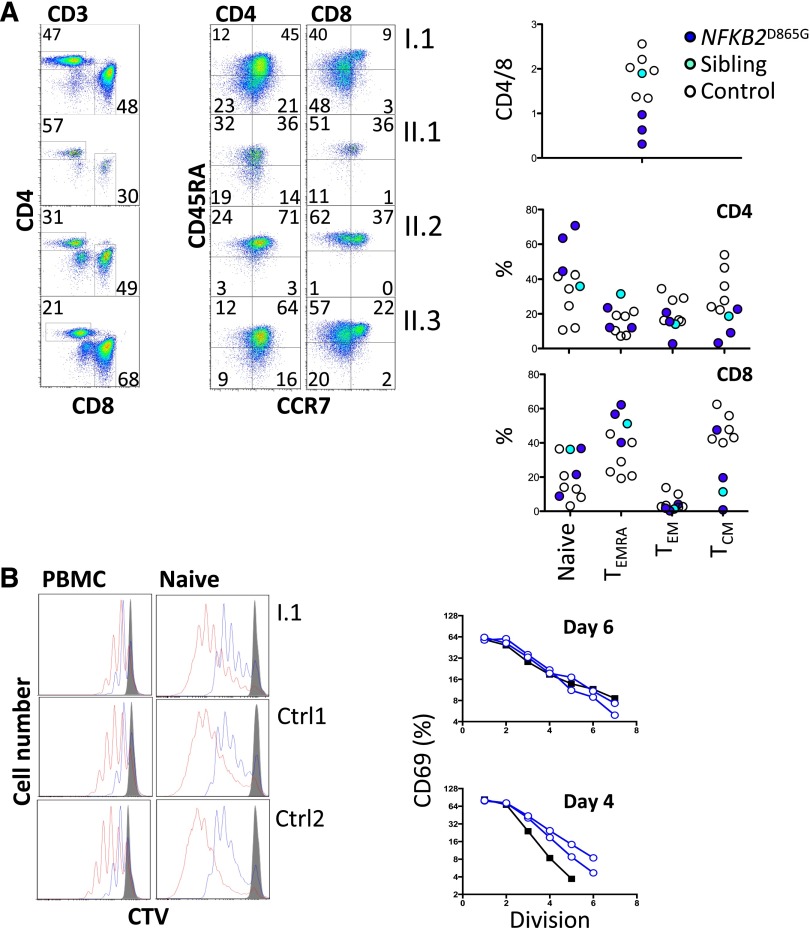
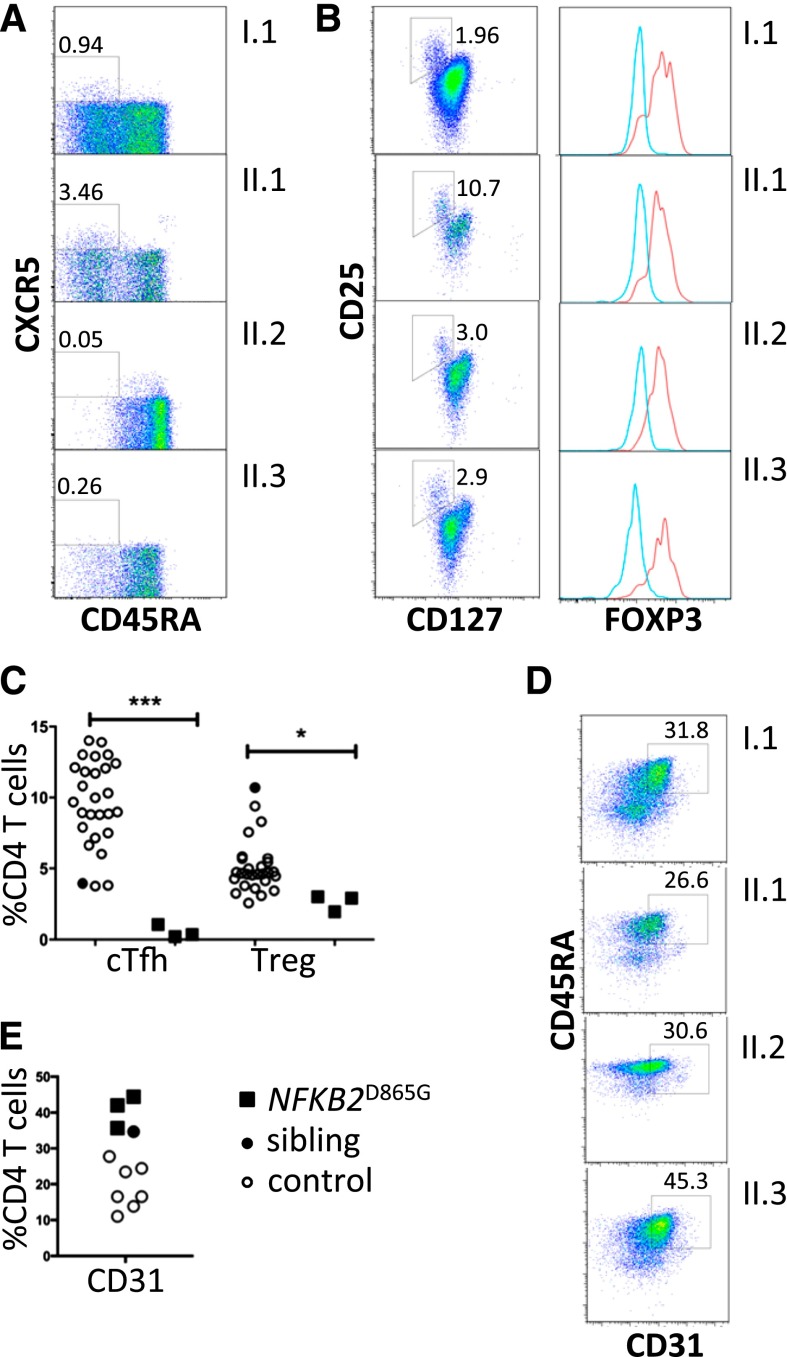
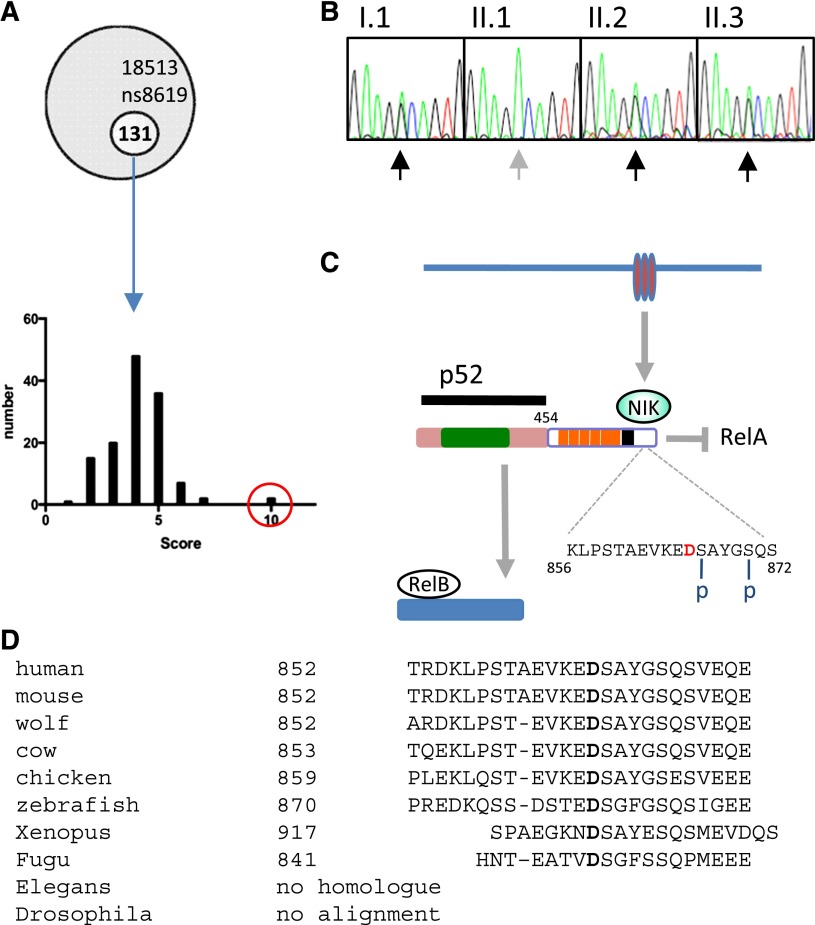
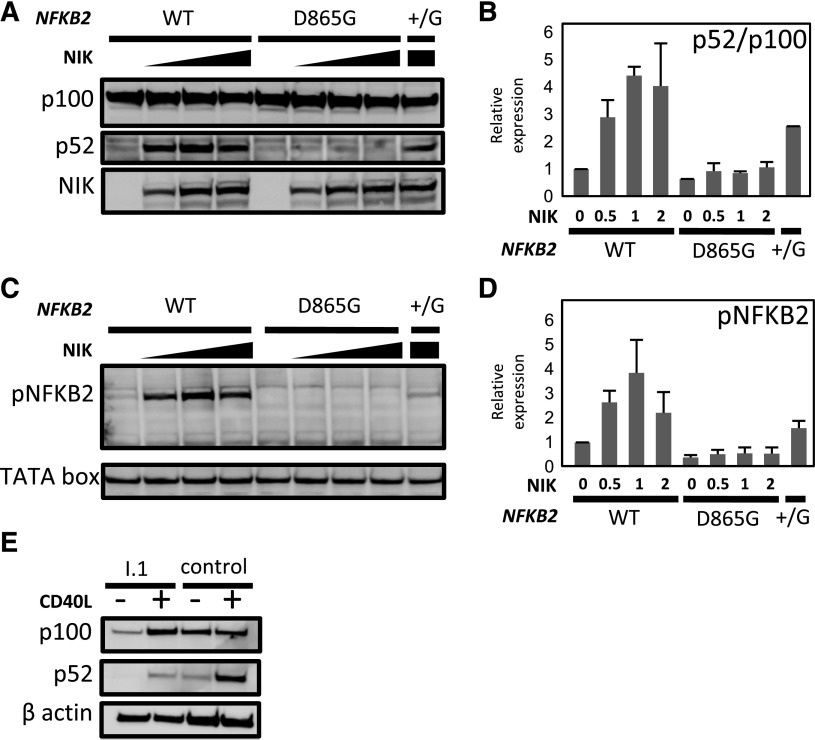
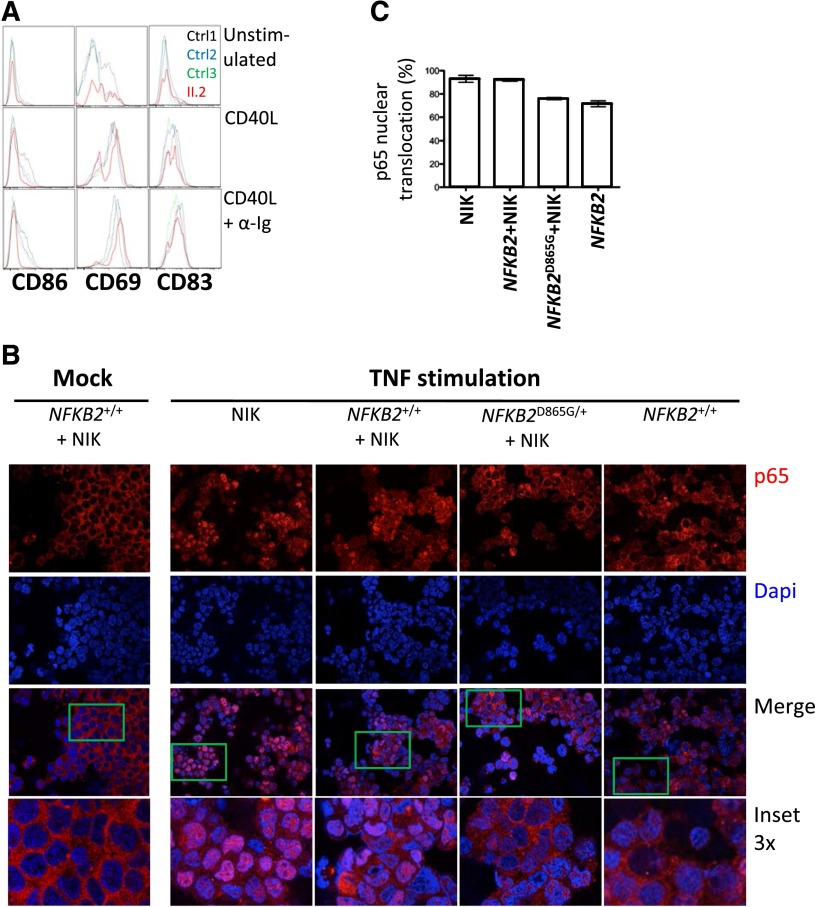
Most genetic defects that arrest B-cell development in the bone marrow present early in life with agammaglobulinemia, whereas incomplete antibody deficiency is usually associated with circulating B cells. We report 3 related individuals with a novel form of severe B-cell deficiency associated with partial persistence of serum immunoglobulin arising from a missense mutation in NFKB2. Significantly, this point mutation results in a D865G substitution and causes a failure of p100 phosphorylation that blocks processing to p52. Severe B-cell deficiency affects mature and transitional cells, mimicking the action of rituximab. This phenotype appears to be due to disruption of canonical and noncanonical nuclear factor κB pathways by the mutant p100 molecule. These findings could be informative for therapeutics as well as immunodeficiency.


Figures

Figure 1
Figure 1
Flow cytometric analysis of B lymphocytes. (A) Pedigree with those affected shown in closed symbols. (B) Analysis of circulating B cells. CD19+ CD27 cells represent naive B cells; CD19+ CD27+ cells indicate memory B cells. (C) Summary of B-cell numbers relative to other CVID-affected patients. (D) Analysis of transitional B cells in family members. (E) Summary of CD10hi CD24lo cells in CVID patients and normal controls. I.1 and II.2 are indicated by red symbols. (F) Analysis of CD10 and CD24 expression by CD19+ cells obtained from cord blood, tonsil, and peripheral blood of a patient after treatment with rituximab. Plots are representative of 5 similar samples. (G) Bone marrow leukocytes of proband and control, gated on CD19+ cells to show CD10, CD45, and CD34. CD45+ CD10+ CD34+ cells are pro-B cells and CD45+ CD10+ CD34 cells are pre-B cells. (H) Expression of indicated transcripts in bone marrow aspirate from proband relative to their expression in 2 normal control marrows. Ctrl, control.
Figure 2
Figure 2
T-cell differentiation and activation. (A) Enumeration of memory and effector T cells. Representative profiles (left) and summary data (right). (B) Analysis of proliferation of either naive CD4+ T cells (right) separated by negative selection with magnetic beads or CD4+ T cells within PBMCs (left) by dilution of cell trace violet after stimulation with CD3 and CD28. Cells were harvested and analyzed by flow cytometry on day 4 (blue) and day 6 (red). Histograms were gated on CD3 and CD4. Unstimulated control cells are shown (gray). In the same experiment, naive CD4+ T cells were analyzed for activation based on induction of CD69. The percentage of CD69+ cells at each division was determined (day 6, upper panel; day 4, lower panel) and plotted (controls, open blue; I.1, black filled). CTV, cell trace violet; TCM, central memory T cells; TEM, effector memory T cells; TEMRA, CD45RA+ effector memory T cells.
Figure 3
Figure 3
Regulatory T cells and recent thymic emigrants. (A) Peripheral blood flow cytometric analyses, gated on CD4+ T cells and analyzed for Tfh-like cells (boxed as CXCR5+ CD45RA). (B) Regulatory T cells (boxed CD127low, CD25high). Percentage of CD4 T cells within the gated subsets is shown. Histograms show intracellular staining for Foxp3 expression in cells within the CD127low, CD25high gate (red histogram) and within the cells excluded from this gate (blue histogram). (C) Frequencies of circulating Tfh-like cells (cTfh) and Tregs (*P = .03; ***P < .0001). (D) Frequencies of CD31+ CD4+ recent thymic emigrants (E) among CD4 T cells from healthy controls (open circles); healthy sibling (black-filled circles); NFKB2 mutant siblings and parent (black-filled squares). (E) Flow cytometric analysis of peripheral blood mononuclear cells for recent thymic emigrants (CD31+ CD4+).
Figure 4
Figure 4
NFKB2 mutation. (A) Frequency histogram of novel alleles according to filter based on tissue expression, phenotype of mice with mutations in orthologs, disease association, GO, and PolyPhen-2 scores (NFKB2 in red circle). (B) Sanger sequencing of NFKB2 (according to pedigree in Figure 1). (C) Summary of p100 processing. Amino acid D in red indicates the location of D865G mutation, which is adjacent to one of the N-terminal phosphorylation sites (S866). Rel homology domain (green), ankyrin repeat domains (orange), death domain (black). (D) Conservation of mutated residue of NF-κB2.
Figure 5
Figure 5
Effect of D865 > G mutation on NIK-induced p100 processing and serine phosphorylation. (A-B) HEK293 cells were co-transfected with expression vectors encoding wild-type (WT) or D865 > G mutant NFKB2 together with varying amounts of MAP3K14 expression vector encoding NIK. (B) Summary of relative expression of p100 and p52 determined as determined in (A). Results were normalized to the ratio in the absence of NIK. (C-D) Phosphorylation of serines 867 and 870 in response to increasing dose of NIK. (D) Summary of phospho-NFKB2 as determined in (C). TATA box was used as a loading control. (E) p100 processing in response to CD40L in dendritic cells generated in vitro from PBMCs from I.1 or a healthy control.
Figure 6
Figure 6
Defective canonical pathway activation in the presence of nonprocessable p100. (A) Analysis of B cells from II.2 relative to controls for expression of CD86, CD69, and CD83 after 24 hours of treatment with indicated stimuli. (B) Nuclear translocation of p65 (red) in HEK293 cells transfected with the indicated constructs after stimulation with TNF. A 4,6 diamidino-2-phenylindole counterstain identifies cell nuclei. (C) Summary of p65 translocation of immunofluorescence confocal.

References

    1. Conley ME, Dobbs AK, Farmer DM, et al. Primary B cell immunodeficiencies: comparisons and contrasts. Annu Rev Immunol. 2009;27(1):199–227. - PubMed
    1. Pieper K, Grimbacher B, Eibel H. B-cell biology and development. J Allergy Clin Immunol. 2013;131(4):959–971. - PubMed
    1. Yong PFK, Thaventhiran JED, Grimbacher B. “A rose is a rose is a rose,” but CVID is not CVID common variable immune deficiency (CVID), what do we know in 2011? Adv Immunol. 2011;111:47–107. - PubMed
    1. Conley ME, Mathias D, Treadaway J, Minegishi Y, Rohrer J. Mutations in btk in patients with presumed X-linked agammaglobulinemia. Am J Hum Genet. 1998;62(5):1034–1043. - PMC - PubMed
    1. Tsukada S, Saffran DC, Rawlings DJ, et al. Deficient expression of a B cell cytoplasmic tyrosine kinase in human X-linked agammaglobulinemia. Cell. 1993;72(2):279–290. - PubMed

Publication types

MeSH terms

Associated data