. 2014 Sep 18;14(9):17430-50.
doi: 10.3390/s140917430.

Statistical analysis-based error models for the Microsoft Kinect(TM) depth sensor

Affiliations

Statistical analysis-based error models for the Microsoft Kinect(TM) depth sensor

Benjamin Choo et al. Sensors (Basel). .

Abstract

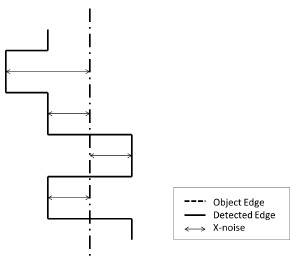
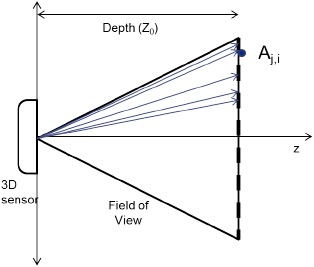
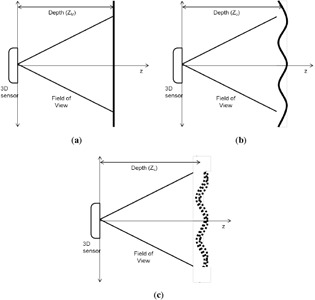
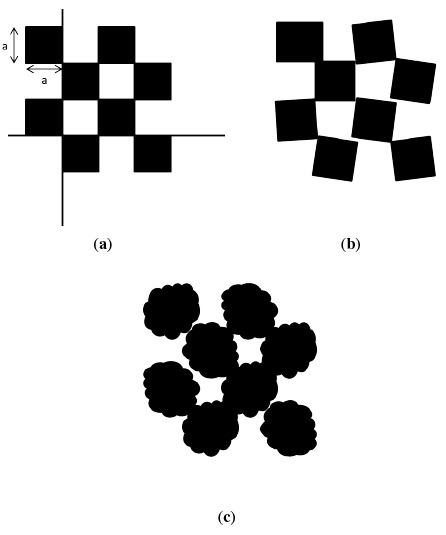
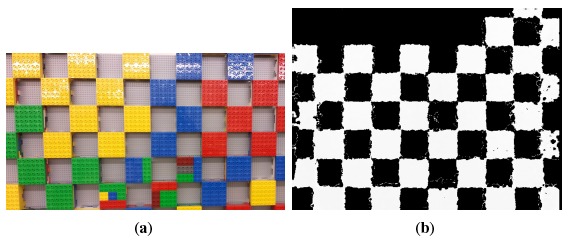
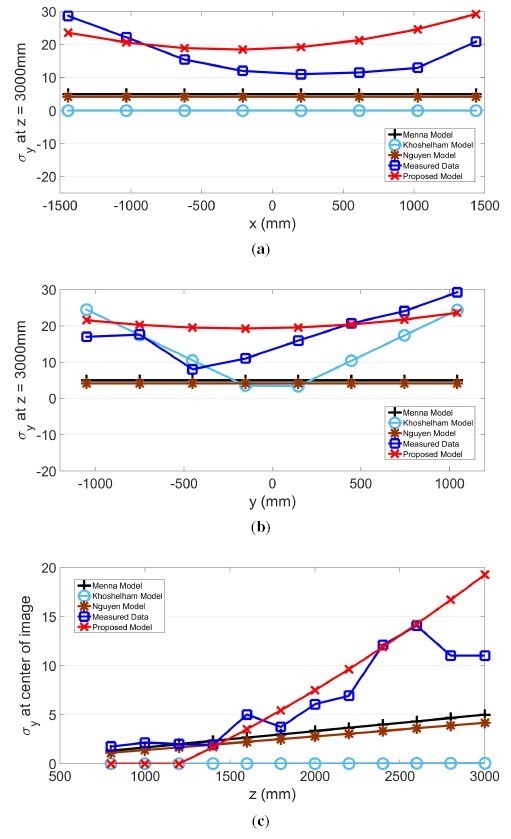
The stochastic error characteristics of the Kinect sensing device are presented for each axis direction. Depth (z) directional error is measured using a flat surface, and horizontal (x) and vertical (y) errors are measured using a novel 3D checkerboard. Results show that the stochastic nature of the Kinect measurement error is affected mostly by the depth at which the object being sensed is located, though radial factors must be considered, as well. Measurement and statistics-based models are presented for the stochastic error in each axis direction, which are based on the location and depth value of empirical data measured for each pixel across the entire field of view. The resulting models are compared against existing Kinect error models, and through these comparisons, the proposed model is shown to be a more sophisticated and precise characterization of the Kinect error distributions.


Figures

Figure 1.
Figure 1.
Kinect depth determination model.
Figure 2.
Figure 2.
Example of x-noise.
Figure 3.
Figure 3.
Uneven pixel directions in the real world.
Figure 4.
Figure 4.
Flat surfaces in the (a) model, (b) ground-truth and (c) measurement domains are displayed.
Figure 5.
Figure 5.
3D checkerboard design.
Figure 6.
Figure 6.
3D checkerboards with sides of length a in the (a) model, (b) ground-truth and (c) measurement domains are displayed.
Figure 7.
Figure 7.
(a) The 3D checkerboard used for x, y error analysis, and (b) the resulting 3D checkerboard measurement.
Figure 8.
Figure 8.
(a) The σz results at z = 1000 mm and (b) the σx results at z = 2400 mm.
Figure 9.
Figure 9.
(a) shows σz along the x-axis, and (b) and (c) show σz along the y and z-axes, respectively.
Figure 10.
Figure 10.
(a) σx along the x-axis and (b,c) σx along the y- and z-axes, respectively.
Figure 11.
Figure 11.
(a) σy along the x-axis and (b,c) σy along the y- and z-axes, respectively.

References

    1. Rude D., Adams S., Cogill R., Beling P. Task Recognition from Joint Tracking Data Using Simultaneous Feature Selection and Parameter Estimation in Hidden Markov Models. 2014 under review.
    1. Cho K.B., Lee B.H. Intelligent Lead: A Novel HRI Sensor for Guide Robots. Sensors. 2012;12:8301–8318. - PMC - PubMed
    1. Susperregi L., Sierra B., Castrilln M., Lorenzo J., Martínez-Otzeta J., Lazkano E. On the Use of a Low-Cost Thermal Sensor to Improve Kinect People Detection in a Mobile Robot. Sensors. 2013;13:14687–14713. - PMC - PubMed
    1. Nock C., Taugourdeau O., Delagrange S., Messier C. Assessing the Potential of Low-Cost 3D Cameras for the Rapid Measurement of Plant Woody Structure. Sensors. 2013;13:16216–16233. - PMC - PubMed
    1. Azzari G., Goulden M., Rusu R. Rapid Characterization of Vegetation Structure with a Microsoft Kinect Sensor. Sensors. 2013;13:2384–2398. - PMC - PubMed

Publication types