Delayed initiation but not gradual advancement of enteral formula feeding reduces the incidence of necrotizing enterocolitis (NEC) in preterm pigs
- PMID: 25238061
- PMCID: PMC4169518
- DOI: 10.1371/journal.pone.0106888
Delayed initiation but not gradual advancement of enteral formula feeding reduces the incidence of necrotizing enterocolitis (NEC) in preterm pigs
Abstract
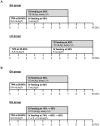
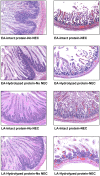
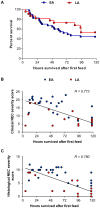
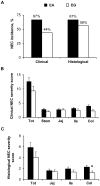
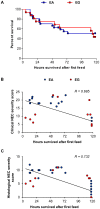
Enteral formula feeding is a risk factor for necrotizing enterocolitis (NEC) in premature infants, yet studies are conflicting regarding the safest timing for introduction and advancement of feeds. Our aim was to test the effects of early vs. late initiation and abrupt vs. gradual advancement of enteral feeding of an intact vs. hydrolyzed protein formula on NEC incidence and severity in preterm pigs. In Experiment 1, preterm pigs received total parenteral nutrition (TPN) at birth with abrupt initiation of enteral formula feeds (50% full intake) on d of life (DOL) 2 (EA) or 5 (LA) while PN continued. Pigs were also fed formula containing either intact or hydrolyzed protein. In Experiment 2, preterm pigs received TPN at birth with enteral, hydrolyzed-protein formula feeds introduced on DOL 2 either abruptly (EA; 50% full feeds) or gradually (EG; 10-50% full feeds over 5 d) while PN continued. NEC incidence and severity were assessed based on macroscopic and histological scoring. In Experiment 1, NEC incidence (41% vs. 70%, P<0.05) and severity were reduced in LA vs. EA groups and LA was associated with a higher survival rate, daily weight gain and jejunum villus height. Piglets fed hydrolyzed vs. intact protein formula had lower stomach content weights and similar NEC incidence. In Experiment 2, NEC incidence and severity were not different between pigs the EG vs. EA group. Proinflammatory gene expression (IL-1β, IL-6 and S100A9) in the ileum was lower in both LA and EG vs. EA groups. In conclusion, delayed initiation but not gradual advancement of enteral feeding is protective against NEC in preterm pigs. Feeding hydrolyzed vs. intact protein formula improved gastric transit without affecting the NEC incidence.
Conflict of interest statement
Figures




Similar articles
-
Modulation of intestinal inflammation by minimal enteral nutrition with amniotic fluid in preterm pigs.JPEN J Parenter Enteral Nutr. 2014 Jul;38(5):576-86. doi: 10.1177/0148607113489313. Epub 2013 May 28. JPEN J Parenter Enteral Nutr. 2014. PMID: 23715776
-
Enteral feeding induces diet-dependent mucosal dysfunction, bacterial proliferation, and necrotizing enterocolitis in preterm pigs on parenteral nutrition.Am J Physiol Gastrointest Liver Physiol. 2008 Nov;295(5):G1092-103. doi: 10.1152/ajpgi.00414.2007. Epub 2008 Sep 25. Am J Physiol Gastrointest Liver Physiol. 2008. PMID: 18818317
-
Diet-dependent effects of minimal enteral nutrition on intestinal function and necrotizing enterocolitis in preterm pigs.JPEN J Parenter Enteral Nutr. 2011 Jan;35(1):32-42. doi: 10.1177/0148607110377206. JPEN J Parenter Enteral Nutr. 2011. PMID: 21224432
-
Feeding practices and necrotizing enterocolitis.Clin Perinatol. 2013 Mar;40(1):1-10. doi: 10.1016/j.clp.2012.12.001. Epub 2013 Jan 17. Clin Perinatol. 2013. PMID: 23415260 Free PMC article. Review.
-
Early enteral feeding in preterm infants.Semin Perinatol. 2019 Nov;43(7):151159. doi: 10.1053/j.semperi.2019.06.007. Epub 2019 Jul 24. Semin Perinatol. 2019. PMID: 31443906 Review.
Cited by
-
Increased Circulating Cortisol After Vaginal Birth Is Associated With Increased FGF19 Secretion in Neonatal Pigs.Endocrinology. 2022 Nov 14;164(1):bqac188. doi: 10.1210/endocr/bqac188. Endocrinology. 2022. PMID: 36367732 Free PMC article.
-
Current Knowledge of Necrotizing Enterocolitis in Preterm Infants and the Impact of Different Types of Enteral Nutrition Products.Adv Nutr. 2017 Jan 17;8(1):80-91. doi: 10.3945/an.116.013193. Print 2017 Jan. Adv Nutr. 2017. PMID: 28096129 Free PMC article. Review.
-
Superior performance of biofilm versus planktonic Limosilactobacillus reuteri in protection of the intestines and brain in a piglet model of necrotizing enterocolitis.Sci Rep. 2023 Oct 23;13(1):17740. doi: 10.1038/s41598-023-44676-5. Sci Rep. 2023. PMID: 37872187 Free PMC article.
-
Potential Benefits of Bovine Colostrum in Pediatric Nutrition and Health.Nutrients. 2021 Jul 26;13(8):2551. doi: 10.3390/nu13082551. Nutrients. 2021. PMID: 34444709 Free PMC article. Review.
-
The intestinal-renal axis for arginine synthesis is present and functional in the neonatal pig.Am J Physiol Endocrinol Metab. 2017 Aug 1;313(2):E233-E242. doi: 10.1152/ajpendo.00055.2017. Epub 2017 Jun 13. Am J Physiol Endocrinol Metab. 2017. PMID: 28611027 Free PMC article.
References
-
- Tudehope DI (2005) The epidemiology and pathogenesis of neonatal necrotizing enterocolitis. J Paediatr Child Health 41: 167–168. - PubMed
-
- Henry MC, Moss RL (2009) Necrotizing enterocolitis. Annu Rev Med 60: 111–124. - PubMed
-
- Lin PW, Stoll BJ (2006) Necrotising enterocolitis. Lancet 368: 1271–1283. - PubMed
-
- Cilieborg MS, Boye M, Sangild PT (2012) Bacterial colonization and gut development in preterm neonates. Early Hum Dev 88 Suppl 1 S41–S49. - PubMed
Publication types
MeSH terms
Grants and funding
LinkOut - more resources
Full Text Sources
Other Literature Sources
Research Materials
Miscellaneous

