. 2014 Sep 19;9(9):e107653.
doi: 10.1371/journal.pone.0107653. eCollection 2014.

DNA methylation signatures triggered by prenatal maternal stress exposure to a natural disaster: Project Ice Storm

Affiliations

DNA methylation signatures triggered by prenatal maternal stress exposure to a natural disaster: Project Ice Storm

Lei Cao-Lei et al. PLoS One. .

Abstract

Background: Prenatal maternal stress (PNMS) predicts a wide variety of behavioral and physical outcomes in the offspring. Although epigenetic processes may be responsible for PNMS effects, human research is hampered by the lack of experimental methods that parallel controlled animal studies. Disasters, however, provide natural experiments that can provide models of prenatal stress.

Methods: Five months after the 1998 Quebec ice storm we recruited women who had been pregnant during the disaster and assessed their degrees of objective hardship and subjective distress. Thirteen years later, we investigated DNA methylation profiling in T cells obtained from 36 of the children, and compared selected results with those from saliva samples obtained from the same children at age 8.

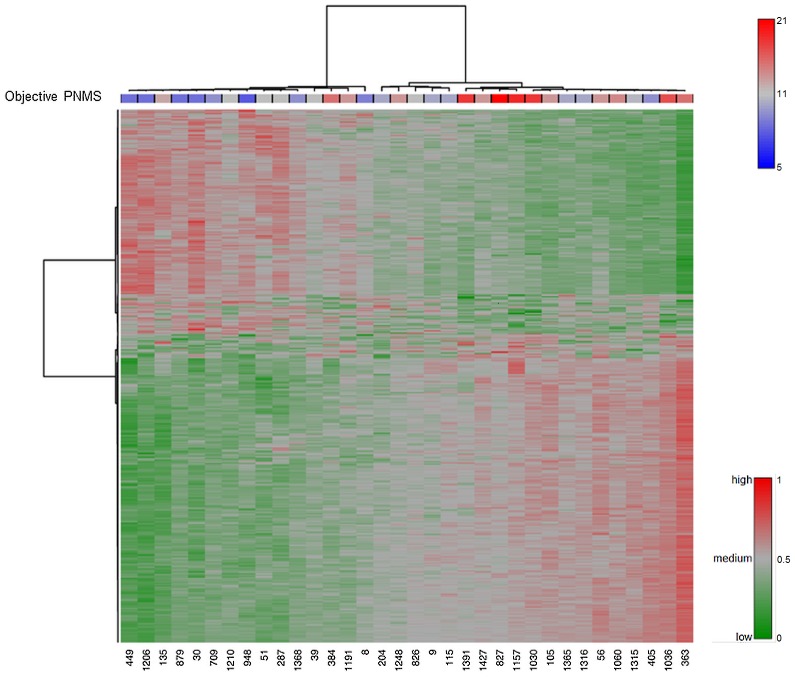
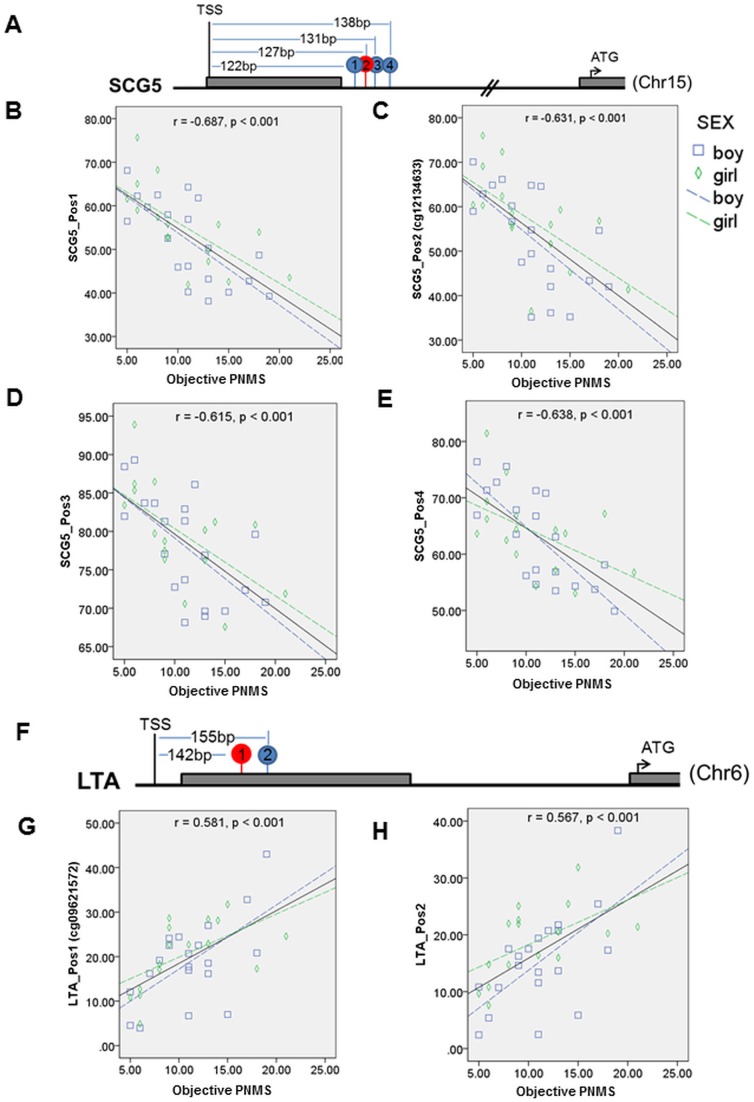
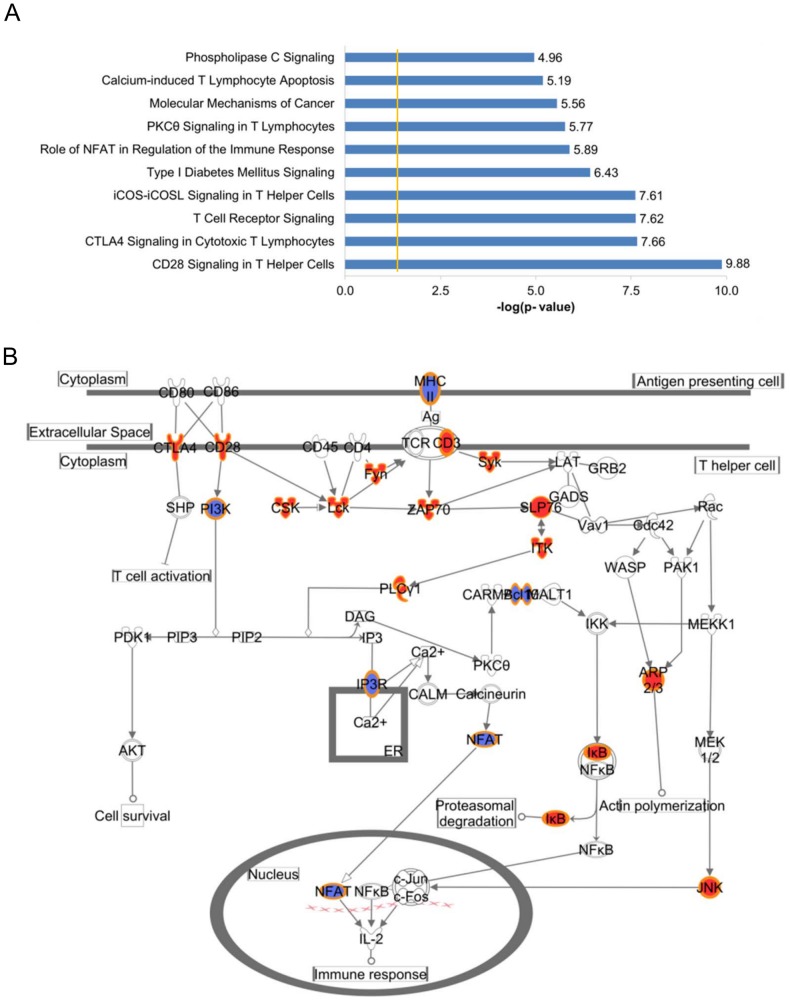
Results: Prenatal maternal objective hardship was correlated with DNA methylation levels in 1675 CGs affiliated with 957 genes predominantly related to immune function; maternal subjective distress was uncorrelated. DNA methylation changes in SCG5 and LTA, both highly correlated with maternal objective stress, were comparable in T cells, peripheral blood mononuclear cells (PBMCs) and saliva cells.

Conclusions: These data provide first evidence in humans supporting the conclusion that PNMS results in a lasting, broad, and functionally organized DNA methylation signature in several tissues in offspring. By using a natural disaster model, we can infer that the epigenetic effects found in Project Ice Storm are due to objective levels of hardship experienced by the pregnant woman rather than to her level of sustained distress.


Conflict of interest statement

Competing Interests: The authors have declared that no competing interests exist.

Figures

Figure 1
Figure 1. Differentially methylated CGs responding to objective PNMS (Storm32 score).
Heatmap represents the DNA methylation levels of 500 CGs most significantly associated with objective PNMS (Storm32 score) in 34 donors. Each column represents an individual and each row a single CG. Each cell represents the CG methylation level for one site in one sample. A color gradient intensity scale at the lower right-hand corner of the Heatmap expresses methylation changes. The darkest green indicates the lowest methylation level (Beta-value = 0), the gray indicates the median score (Beta-value = 0.5) and the darkest red indicates the highest methylation level (Beta-value = 1). The color bar on the top of the Heatmap indicates subjects' categorization by their mother's objective PNMS. A color gradient intensity scale at the higher right-hand corner of the Heatmap shows the level of objective PNMS. The darkest blue indicates the lowest objective PNMS (Storm32 score = 5), the gray indicates the median objective PNMS (Storm32 score = 11) and the darkest red indicates the highest objective PNMS (Storm32 score = 21).
Figure 2
Figure 2. The correlation between objective PNMS and methylation data from pyrosequencing in SCG5 and LTA.
A) Physical map of CGs in the SCG5. Grey bars represent the exons. CG labeled in red represents the interrogated CG and that labeled in blue represents the immediately surrounding CGs. B–E) Correlations between objective PNMS and methylation level of Positions1, 2(cg12134633), 3 and 4. F) Physical map of CGs in the LTA. G–H) Correlations between objective PNMS and methylation level of Position1 (cg09621572) and 2. Blue squares indicate male and green diamonds indicates female. Dashed blue line represents the fitting line in males and green in females.
Figure 3
Figure 3. The molecular and cellular functions of the 957 genes analyzed with IPA.
A) Top 10 functions of the 957 differentially methylated genes. The y-axis shows functions while the x-axis shows -log(p-value). The yellow line indicates the threshold value of p<0.05. B) The most significant canonical pathway: CD28 Signaling in T helper cells. Genes whose methylation levels are positively correlated with objective PNMS are colored in red and those whose methylation levels are negatively correlated with objective PNMS are colored in blue. CD247: CD247 molecule; FYN: a membrane-associated tyrosine kinase; CD3E: CD3-epsilon polypeptide; CSK: C-Src Tyrosine Kinase; PLCG1: Phospholipase C, Gamma 1; NFATC1: Nuclear Factor Of Activated T-Cells, Cytoplasmic, Calcineurin-Dependent 1; HLA-DMB: Major Histocompatibility Complex, Class II, DM Beta; ITPR1: inositol 1,4,5-trisphosphate receptor, type 1; CD3D: CD3d Molecule, Delta; CTLA4: cytotoxic T-lymphocyte-associated protein 4; CD3G: CD3-gamma polypeptide; CD28: CD28 Molecule; LCK: lymphocyte-specific protein tyrosine kinase; ACTR3: ARP3 Actin-Related Protein 3 Homolog (Yeast); NFKBIA: nuclear factor of kappa light polypeptide gene enhancer in B-cells inhibitor, alpha; BCL10: B-Cell CLL/Lymphoma 10; SYK: spleen tyrosine kinase; ZAP70: zeta-chain (TCR) associated protein kinase 70 kDa; ARPC4: actin related protein 2/3 complex, subunit 4; MAPK10: mitogen-activated protein kinase 10; HLA-DOB: Major Histocompatibility Complex, Class II, DO Beta; PIK3CD: phosphatidylinositol-4,5-bisphosphate 3-kinase, catalytic subunit delta; PIK3R2: phosphoinositide-3-kinase, regulatory subunit 2 (beta); LCP2: Lymphocyte Cytosolic Protein 2; ITK: IL2-inducible T-cell kinase.
Figure 4
Figure 4. The effect of DNA methylation on SCG5 promoter activity.
A) Schematic representation of the location of CGs investigated in the SCG5 promoter. The CGs are denoted as lollipops and the +1 position indicates the transcription start site (TSS). White bar indicates the region that contains the 4 differentially methylated CGs. Gray bar indicates the luciferase reporter gene in pCpGL-reporter. The two fragments of 650 bp and 692 bp from the SCG5 promoter region were cloned into the BglII and NcoI restriction sites in pCpGL-reporter in sense and anti-sense orientation, respectively. B) Relative luciferase activity of two promoters region before and after mock methylation (−) or complete in vitro methylation with CpG methyltransferase (M.SssI) (+) and transient transfection (48 h) into in HEK293 cell line (***P<0.001). Promoter activity was normalized to protein concentration. The values are the averages of at least three independent experiments. Data are mean ± SEM.

References

    1. Weinstock M (2008) The long-term behavioural consequences of prenatal stress. Neuroscience and Biobehavioral Reviews 32: 1073–1086. - PubMed
    1. Charil A, Laplante DP, Vaillancourt C, King S (2010) Prenatal stress and brain development. Brain Res Rev 65: 56–79. - PubMed
    1. Harris A, Seckl J (2011) Glucocorticoids, prenatal stress and the programming of disease. Horm Behav 59: 279–289. - PubMed
    1. Veru F, Laplante DP, Luheshi G, King S (2014) Prenatal maternal stress exposure and immune function in the offspring. Stress 17: 133–148. - PubMed
    1. Coe CL, Lubach GR (2008) Fetal Programming: Prenatal Origins of Health and Illness. Current Directions in Psychological Science 17: 36–41.

Publication types