. 2015 Feb;9(2):347-60.
doi: 10.1038/ismej.2014.129. Epub 2014 Sep 19.

Seasonal dynamics of active SAR11 ecotypes in the oligotrophic Northwest Mediterranean Sea

Affiliations

Seasonal dynamics of active SAR11 ecotypes in the oligotrophic Northwest Mediterranean Sea

Ian Salter et al. ISME J. 2015 Feb.

Abstract

A seven-year oceanographic time series in NW Mediterranean surface waters was combined with pyrosequencing of ribosomal RNA (16S rRNA) and ribosomal RNA gene copies (16S rDNA) to examine the environmental controls on SAR11 ecotype dynamics and potential activity. SAR11 diversity exhibited pronounced seasonal cycles remarkably similar to total bacterial diversity. The timing of diversity maxima was similar across narrow and broad phylogenetic clades and strongly associated with deep winter mixing. Diversity minima were associated with periods of stratification that were low in nutrients and phytoplankton biomass and characterised by intense phosphate limitation (turnover time<5 h). We propose a conceptual framework in which physical mixing of the water column periodically resets SAR11 communities to a high diversity state and the seasonal evolution of phosphate limitation competitively excludes deeper-dwelling ecotypes to promote low diversity states dominated (>80%) by SAR11 Ia. A partial least squares (PLS) regression model was developed that could reliably predict sequence abundances of SAR11 ecotypes (Q(2)=0.70) from measured environmental variables, of which mixed layer depth was quantitatively the most important. Comparison of clade-level SAR11 rRNA:rDNA signals with leucine incorporation enabled us to partially validate the use of these ratios as an in-situ activity measure. However, temporal trends in the activity of SAR11 ecotypes and their relationship to environmental variables were unclear. The strong and predictable temporal patterns observed in SAR11 sequence abundance was not linked to metabolic activity of different ecotypes at the phylogenetic and temporal resolution of our study.


Figures

Figure 1
Figure 1
Seasonal cycles in total and SAR11 diversity. Shannon diversity index is calculated from tag sequence data of ribosomal RNA gene copies (rDNA). The horizontal dashed and dotted lines are empirical thresholds for high and low diversity regimes, which are marked by grey and white triangles, respectively. The dashed blue and solid red lines are SAR11 diversity expressed as Shannon index (H′) and OTU richness (S), respectively.
Figure 2
Figure 2
Phylogenetic relationship and relative abundance of SAR11 OTUs. Only SAR11 OTUs representing >0.2% of total SAR11 OTU sequences are included. Bubble size is scaled to sequence abundance of OTUs relative to total SAR11 communities. DNA and RNA is 16S rRNA gene copies and 16S rRNA, respectively. High and low diversity sub-groups were empirically defined; see Figure 1 and text for further details.
Figure 3
Figure 3
Monthly averages of SAR11 ecotype abundance and microbial rate processes. The monthly averages of sequence abundance are calculated from (a) ribosomal RNA gene copies and (b) ribosomal RNA tag-sequence data. The abundance of sequences in SAR11 ecotype classifications Ia, Ib and II are cumulative sequences within the phylogenetically defined sub-clades (Figure 2) expressed relative to total SAR11 sequences. The difference of SAR11 sequences not included in these sub-clade classifications is represented by the blank area at the top of panels. White, light grey and dark grey areas represent SAR11 Ia, Ib and II, respectively. White circles and solid line in panel a are phosphate turnover times determined in the NW Mediterranean during 2012, error bars are analytical errors on triplicate measurements. White squares and dashed lines in panel b are leucine incorporation rates temporally binned with 1-month resolution. Error bars are standard errors on monthly measurements integrated over the 7-year time-series.
Figure 4
Figure 4
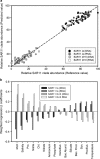
Partial least squares regression model of SAR11 ecotype abundance. (a) The relationship between modelled and observed SAR11 ecotype distributions from ribosomal RNA gene copies and ribosomal RNA tag-sequence data. (b) The weighted regression coefficient of each biogeochemical parameter used to model SAR11 ecotype patterns. Positive values indicate that the input variable is positively correlated to specific output variables. MLD, mixed layer depth; Pro., Prochlorococcus; Chl., chlorophyll; NanoEuK., nanoeukaryotes; Bac. Abund., bacterial abundance; Bac. Prod., bacterial productivity; Syn., Synechococcus, PicoEuk., picoeukaryotes, Temp., temperature.
Figure 5
Figure 5
Leucine incorporation and RNA/DNA ratios in the SAR11 clade. The ratio of ribosomal RNA (rRNA) to ribosomal RNA gene copies (rDNA) were calculated by summing the sequences for all SAR11 clusters. SAR11-active cells were calculated as the percentage of total SAR11 cells assimilating tritiated leucine.
Figure 6
Figure 6
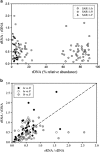
rRNA/rDNA activity ratios and abundance of SAR11 ecotypes. (a) The relationship between ecotype activity (rRNA/rDNA) and relative abundance (rDNA%) for Ia (white circles), Ib (grey squares) and II (black triangles) and (b) relationship of rRNA to rDNA ratios between SAR11 ecotypes. Dashed line is 1:1. Correlation statistics are Ia and Ib (R=0.56; P<0.001); Ib and II (R=0.47; P<0.01); and Ia and II (R=0.38; P<0.05).

References

    1. Alonso-Sáez LV, Balagué E, Sà O, Sánchez JM, González J, Pinhassi R, et al. Seasonality in bacterial diversity in NW Mediterranean coastal waters: assessment through clone libraries, fingerprinting and fluorescence in situ hybridization. FEMS Microbiol Ecol. 2007;60:98–112. - PubMed
    1. Alonso-Sáez LV, Gasol JP. Seasonal variations in the contributions of different bacterial groups to the uptake of low-molecular-weight compounds in Northwestern Mediterranean Coastal Waters. Appl Environ Microbiol. 2007;73:3528–3535. - PMC - PubMed
    1. Beman JM, Steele JA, Furhman JA. Co-occurrence patterns for abundant marine archaeal and bacterial lineages in the deep chlorophyll maximum of coastal California. ISME J. 2011;5:1077–1085. - PMC - PubMed
    1. Benjamini Y, Hochberg Y. Controlling the false discovery Rate: A practical and powerful approach to multiple testing. J R Stat Soc B. 1995;57:289–300.
    1. Blanquer A, Uriz MJ, Galand PE. Removing environmental sources of variation to gain insight on symbionts vs. transient microbes in high and low microbial abundance sponges. Environ Microbiol. 2013;15:3008–3019. - PubMed

Publication types