

Maternal caffeine intake during pregnancy is associated with risk of low birth weight: a systematic review and dose-response meta-analysis
- PMID: 25238871
- PMCID: PMC4198801
- DOI: 10.1186/s12916-014-0174-6
Maternal caffeine intake during pregnancy is associated with risk of low birth weight: a systematic review and dose-response meta-analysis
Abstract
Background: Considerable controversy exists regarding the relation between maternal caffeine intake during pregnancy and risk of low birth weight (birth weight <2,500 g). We aim to assess this association using a systematic review and dose-response meta-analysis of prospective studies.
Methods: Potential articles were identified by searching MEDLINE and SCOPUS databases through 17 July 2013. Two authors independently extracted information on study design, participant characteristics and estimates of associations. Random-effects models were used to derive the summary relative risks (RRs) and corresponding 95% confidence intervals (CIs). Dose-response relationships were assessed using generalized least-squares trend estimation.
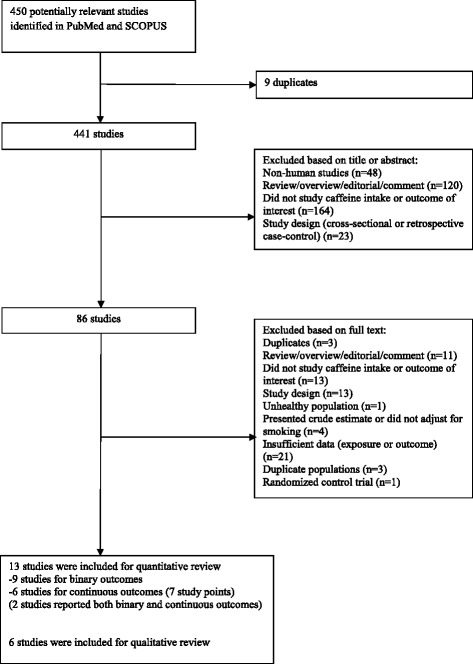
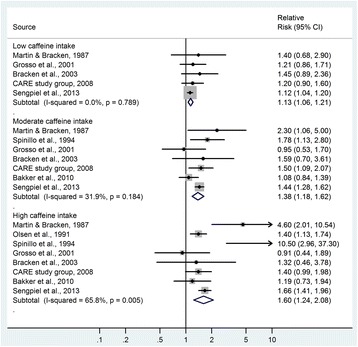
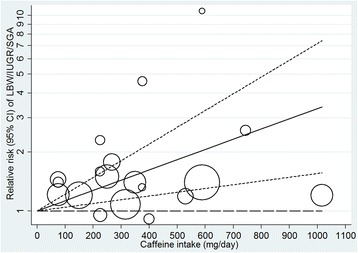
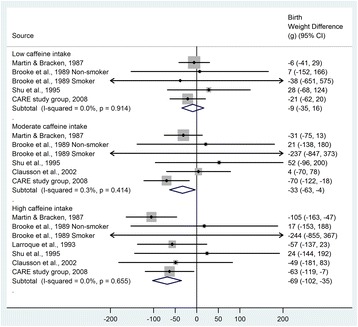
Results: In our meta-analysis, we included 13 prospective studies: 9 with low birth weight as a binary outcome variable (90,747 participants and 6,303 cases) and 6 with birth weight as a continuous outcome variable (10,015 participants; 2 studies reported both types of outcomes). Compared with the reference category with no or very low caffeine intake, the RR (95% CI) of low birth weight was 1.13 (1.06 to 1.21; I 2 0.0%) for low intake (50 to 149 mg/day), 1.38 (1.18 to 1.62; I 2 31.9%) for moderate intake (150 to 349 mg/day), and 1.60 (1.24 to 2.08; I 2 65.8%) for high intake (≥350 mg/day). In the dose-response analysis, each 100-mg/day increment in maternal caffeine intake (around one cup of coffee) was associated with 13% (RR 1.13, 1.06 to 1.21) higher risk of low birth weight. The association persisted in strata defined according to various study characteristics. Moderate (-33 g, 95% CI -63 to -4; I 2 0.3%) and high (-69 g, 95% CI -102 to -35; I 2 0.0%) caffeine intakes were also associated with a significantly lower birth weight as compared with the reference category.
Conclusions: Higher maternal caffeine intake during pregnancy was associated with a higher risk of delivering low birth weight infants. These findings support recommendations to restrict caffeine intake during pregnancy to low levels.
Figures
Comment in
-
Potential confounding still clouds the possible association of maternal caffeine intake and low birth weight.Evid Based Med. 2015 Feb;20(1):37. doi: 10.1136/ebmed-2014-110116. Epub 2014 Dec 18. Evid Based Med. 2015. PMID: 25525041 No abstract available.
-
Review: higher caffeine intake during pregnancy increases risk of low birth weight.Evid Based Nurs. 2015 Oct;18(4):111. doi: 10.1136/eb-2014-102027. Epub 2015 Mar 18. Evid Based Nurs. 2015. PMID: 25787183 No abstract available.
References
-
- Wardlaw TM, World Health Organization, UNICEF . Low Birthweight: Country, Regional and Global Estimates. Geneva; New York: WHO; UNICEF; 2004.
Publication types
MeSH terms
Substances
LinkOut - more resources
Full Text Sources
Other Literature Sources
Medical
