

Noninvasive measurement of cardiac stroke volume using pulse wave velocity and aortic dimensions: a simulation study
- PMID: 25238910
- PMCID: PMC4271357
- DOI: 10.1186/1475-925X-13-137
Noninvasive measurement of cardiac stroke volume using pulse wave velocity and aortic dimensions: a simulation study
Abstract
Background: Concerns about the cost-effectiveness of invasive hemodynamic monitoring in critically ill patients using pulmonary artery catheters motivate a renewed search for effective noninvasive methods to measure stroke volume. This paper explores a new approach based on noninvasively measured pulse wave velocity, pulse contour, and ultrasonically determined aortic cross sectional area.
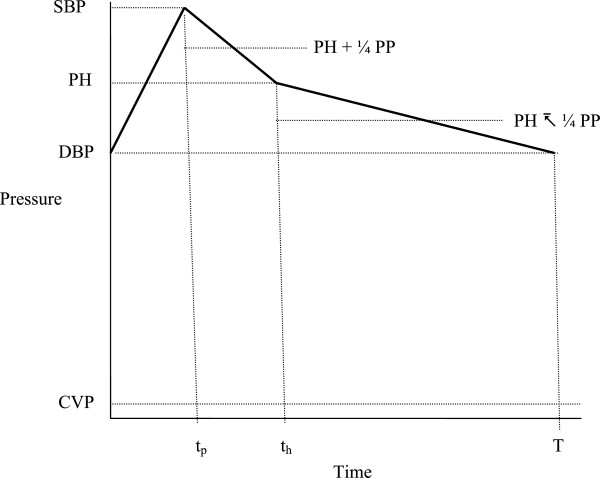
Methods: The Bramwell-Hill equation relating pulse wave velocity to aortic compliance is applied. At the time point on the noninvasively measured pulse contour, denoted th, when pulse amplitude has fallen midway between systolic and diastolic values, the portion of stroke volume remaining in the aorta, and in turn the entire stroke volume, can be estimated from the compliance and the pulse waveform. This approach is tested and refined using a numerical model of the systemic circulation including the effects of blood inertia, nonlinear compliance, aortic tapering, varying heart rate, and varying myocardial contractility, in which noninvasively estimated stroke volumes were compared with known stroke volumes in the model.
Results: The Bramwell-Hill approach correctly allows accurate calculation of known, constant aortic compliance in the numerical model. When nonlinear compliance is present the proposed noninvasive technique overestimates true aortic compliance when pulse pressure is large. However, a reasonable correction for nonlinearity can be derived and applied to restore accuracy for normal and for fast heart rates (correlation coefficient > 0.98).
Conclusions: Accurate estimates of cardiac stroke volume based on pulse wave velocity are theoretically possible and feasible. The precision of the method may be less than desired, owing to the dependence of the final result on the square of measured pulse wave velocity and the first power of ultrasonically measured aortic cross sectional area. However, classical formulas for propagation of random errors suggest that the method may still have sufficient precision for clinical applications. It remains as a challenge for experimentalists to explore further the potential of noninvasive measurement of stroke volume using pulse wave velocity. The technique is non-proprietary and open access in full detail, allowing future users to modify and refine the method as guided by practical experience.
Figures


References
-
- Mimoz O, Rauss A, Rekik N, Brun-Buisson C, Lemaire F, Brochard L. Pulmonary artery catheterization in critically ill patients: a prospective analysis of outcome changes associated with catheter-prompted changes in therapy. Crit Care Med. 1994;22:573–579. doi: 10.1097/00003246-199404000-00011. - DOI - PubMed
-
- Connors AF, Jr, Speroff T, Dawson NV, Thomas C, Harrell FE, Jr, Wagner D, Desbiens N, Goldman L, Wu AW, Califf RM, Fulkerson WJ, Viadillet H, Broste S, BGellamy P, Lynn J, Knaus WA. The effectiveness of right heart catheterization in the initial care of critically ill patients. SUPPORT Investigators. JAMA. 1996;276:889–897. doi: 10.1001/jama.1996.03540110043030. - DOI - PubMed
-
- Harvey S, Harrison DA, Singer M, Ashcroft J, Jones CM, Elbourne D, Brampton W, Williams D, Young D, Rowan K. Assessment of the clinical effectiveness of pulmonary artery catheters in management of patients in intensive care (PAC-Man): a randomised controlled trial. Lancet. 2005;366:472–477. doi: 10.1016/S0140-6736(05)67061-4. - DOI - PubMed
-
- Harvey S, Stevens K, Harrison D, Young D, Brampton W, McCabe C, Singer M, Rowan K. An evaluation of the clinical and cost-effectiveness of pulmonary artery catheters in patient management in intensive care: a systematic review and a randomised controlled trial. Health Technol Assess. 2006;10:iii–iv. doi: 10.3310/hta10290. - DOI - PubMed
MeSH terms
LinkOut - more resources
Full Text Sources
Other Literature Sources
