

Human alteration of natural light cycles: causes and ecological consequences
- PMID: 25239105
- PMCID: PMC4226844
- DOI: 10.1007/s00442-014-3088-2
Human alteration of natural light cycles: causes and ecological consequences
Abstract
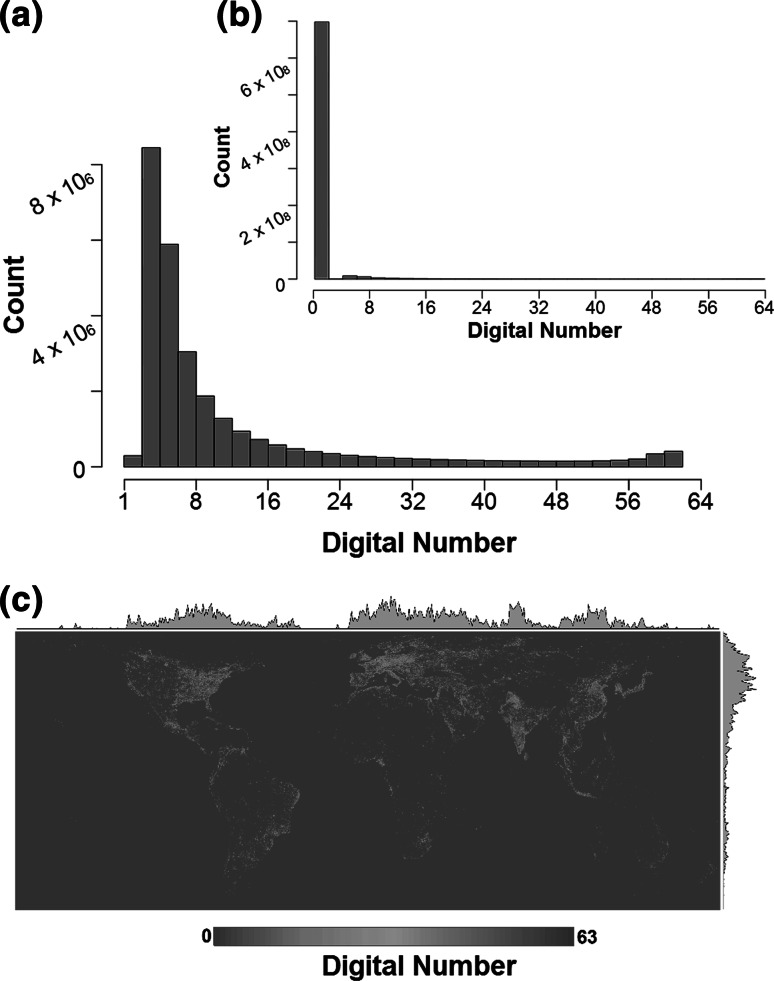
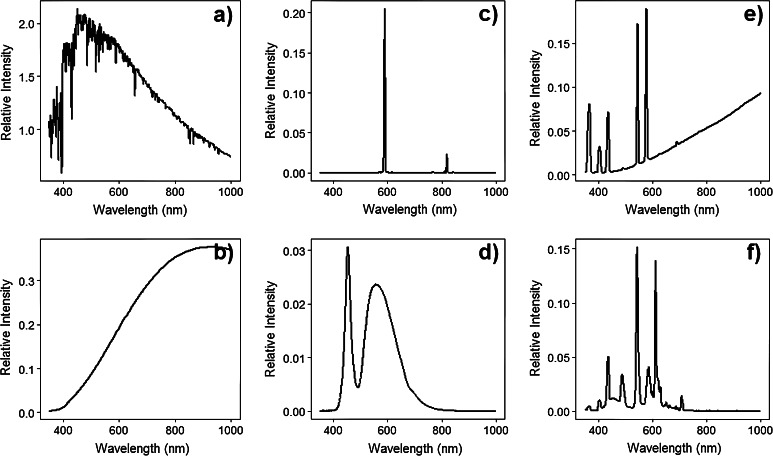
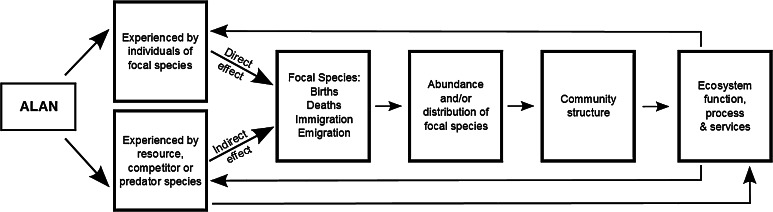
Artificial light at night is profoundly altering natural light cycles, particularly as perceived by many organisms, over extensive areas of the globe. This alteration comprises the introduction of light at night at places and times at which it has not previously occurred, and with different spectral signatures. Given the long geological periods for which light cycles have previously been consistent, this constitutes a novel environmental pressure, and one for which there is evidence for biological effects that span from molecular to community level. Here we provide a synthesis of understanding of the form and extent of this alteration, some of the key consequences for terrestrial and aquatic ecosystems, interactions and synergies with other anthropogenic pressures on the environment, major uncertainties, and future prospects and management options. This constitutes a compelling example of the need for a thoroughly interdisciplinary approach to understanding and managing the impact of one particular anthropogenic pressure. The former requires insights that span molecular biology to ecosystem ecology, and the latter contributions of biologists, policy makers and engineers.
Figures


Similar articles
-
A meta-analysis of biological impacts of artificial light at night.Nat Ecol Evol. 2021 Jan;5(1):74-81. doi: 10.1038/s41559-020-01322-x. Epub 2020 Nov 2. Nat Ecol Evol. 2021. PMID: 33139919
-
Endogenous cycles, activity patterns and energy expenditure of an intertidal fish is modified by artificial light pollution at night (ALAN).Environ Pollut. 2019 Jan;244:361-366. doi: 10.1016/j.envpol.2018.10.063. Epub 2018 Oct 16. Environ Pollut. 2019. PMID: 30352350
-
The ecological impacts of nighttime light pollution: a mechanistic appraisal.Biol Rev Camb Philos Soc. 2013 Nov;88(4):912-27. doi: 10.1111/brv.12036. Epub 2013 Apr 8. Biol Rev Camb Philos Soc. 2013. PMID: 23565807 Review.
-
Potential biological and ecological effects of flickering artificial light.PLoS One. 2014 May 29;9(5):e98631. doi: 10.1371/journal.pone.0098631. eCollection 2014. PLoS One. 2014. PMID: 24874801 Free PMC article.
-
How ecological communities respond to artificial light at night.J Exp Zool A Ecol Integr Physiol. 2018 Oct;329(8-9):394-400. doi: 10.1002/jez.2157. Epub 2018 Apr 14. J Exp Zool A Ecol Integr Physiol. 2018. PMID: 29656458 Free PMC article. Review.
Cited by
-
Artificial light at night suppresses the day-night cardiovascular variability: evidence from humans and rats.Pflugers Arch. 2024 Mar;476(3):295-306. doi: 10.1007/s00424-023-02901-0. Epub 2024 Jan 4. Pflugers Arch. 2024. PMID: 38177874 Free PMC article. Review.
-
Artificial Light at Night of Different Spectral Compositions Differentially Affects Tumor Growth in Mice: Interaction With Melatonin and Epigenetic Pathways.Cancer Control. 2018 Jan-Dec;25(1):1073274818812908. doi: 10.1177/1073274818812908. Cancer Control. 2018. PMID: 30477310 Free PMC article.
-
Enlightening Butterfly Conservation Efforts: The Importance of Natural Lighting for Butterfly Behavioral Ecology and Conservation.Insects. 2018 Feb 12;9(1):22. doi: 10.3390/insects9010022. Insects. 2018. PMID: 29439549 Free PMC article. Review.
-
Pervasiveness of Biological Impacts of Artificial Light at Night.Integr Comp Biol. 2021 Oct 4;61(3):1098-1110. doi: 10.1093/icb/icab145. Integr Comp Biol. 2021. PMID: 34169964 Free PMC article.
-
Anthropogenic disturbance affects calling and collective behaviour in corvid roosts.Philos Trans R Soc Lond B Biol Sci. 2024 Jul 8;379(1905):20230185. doi: 10.1098/rstb.2023.0185. Epub 2024 May 20. Philos Trans R Soc Lond B Biol Sci. 2024. PMID: 38768208 Free PMC article.
References
-
- Amaral S, Monteiro AMV, Camara G, Quintanilha JA. DMSP/OLS night-time light imagery for urban population estimates in the Brazilian Amazon. Int J Remote Sens. 2006;27:855–870.
-
- Arendt J. Melatonin and the pineal gland: influence on mammalian seasonal and circadian physiology. Rev Reprod. 1998;3:13–22. - PubMed
-
- Arlettaz R, Godat S, Meyer H. Competition for food by expanding pipistrelle bat populations (Pipistrellus pipistrellus) might contribute to the decline of lesser horseshoe bats (Rhinolophus hipposideros) Biol Conserv. 2000;93:55–60.
-
- Ashkenazi L, Haim A. Light interference as a possible stressor altering HSP70 and its gene expression levels in brain and hepatic tissues of golden spiny mice. J Exp Biol. 2012;215:4034–4040. - PubMed
-
- Aubrecht C, Elvidge CD, Longcore T, Rich C, Safran J, Strong AE, Eakin CM, Baugh K, Tuttle BT, Howard AT, Erwin EH. A global inventory of coral reef stressors based on satellite observed nighttime lights. Geocarto Int. 2008;23:467–479.
Publication types
MeSH terms
LinkOut - more resources
Full Text Sources
Other Literature Sources
