Comparative Study
. 2014 Sep 20;16(5):439.
doi: 10.1186/s13058-014-0439-1.

Digital mammographic density and breast cancer risk: a case-control study of six alternative density assessment methods

Comparative Study

Digital mammographic density and breast cancer risk: a case-control study of six alternative density assessment methods

Amanda Eng et al. Breast Cancer Res. .

Abstract

Introduction: Mammographic density is a strong breast cancer risk factor and a major determinant of screening sensitivity. However, there is currently no validated estimation method for full-field digital mammography (FFDM).

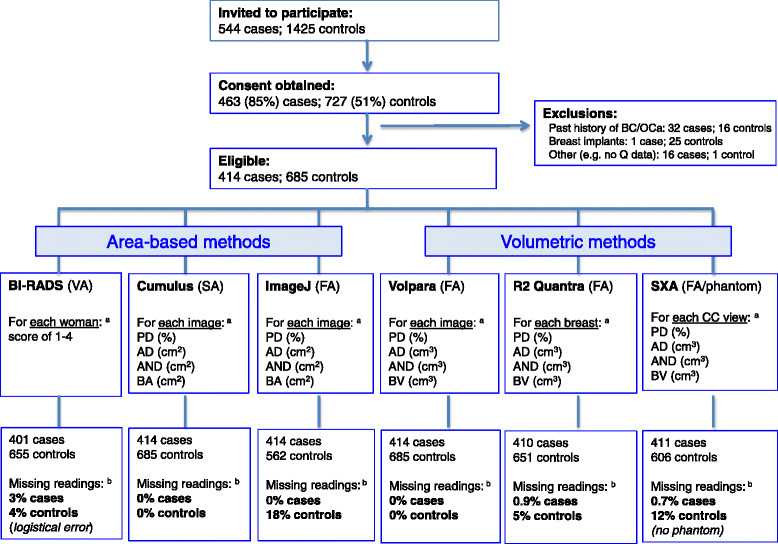
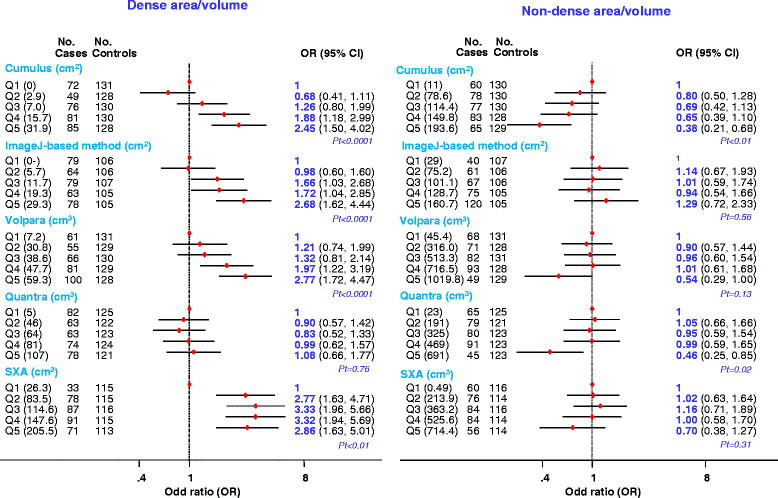
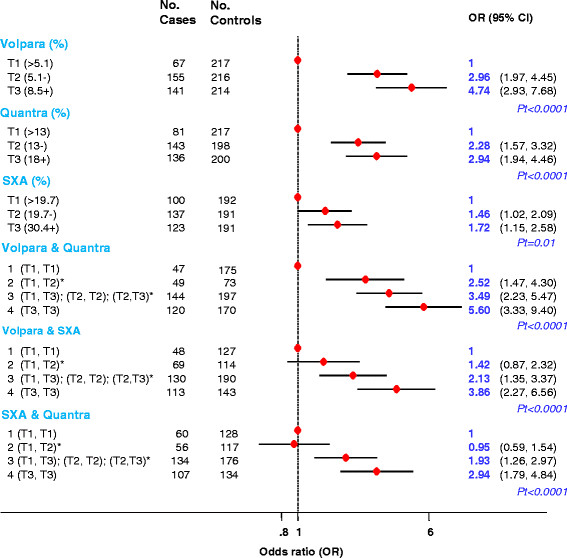
Methods: The performance of three area-based approaches (BI-RADS, the semi-automated Cumulus, and the fully-automated ImageJ-based approach) and three fully-automated volumetric methods (Volpara, Quantra and single energy x-ray absorptiometry (SXA)) were assessed in 3168 FFDM images from 414 cases and 685 controls. Linear regression models were used to assess associations between breast cancer risk factors and density among controls, and logistic regression models to assess density-breast cancer risk associations, adjusting for age, body mass index (BMI) and reproductive variables.

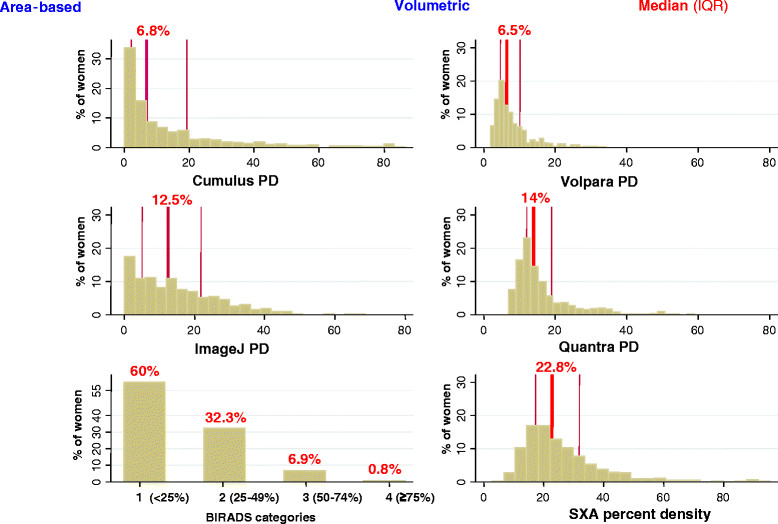
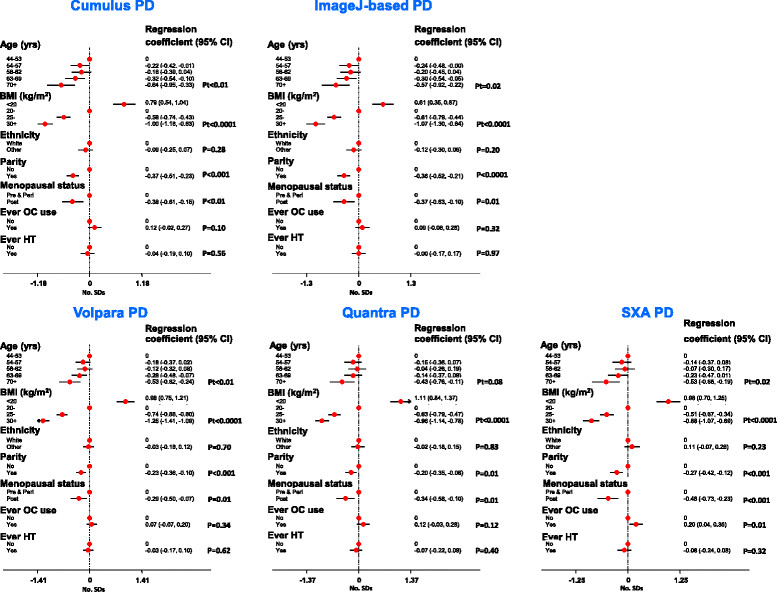
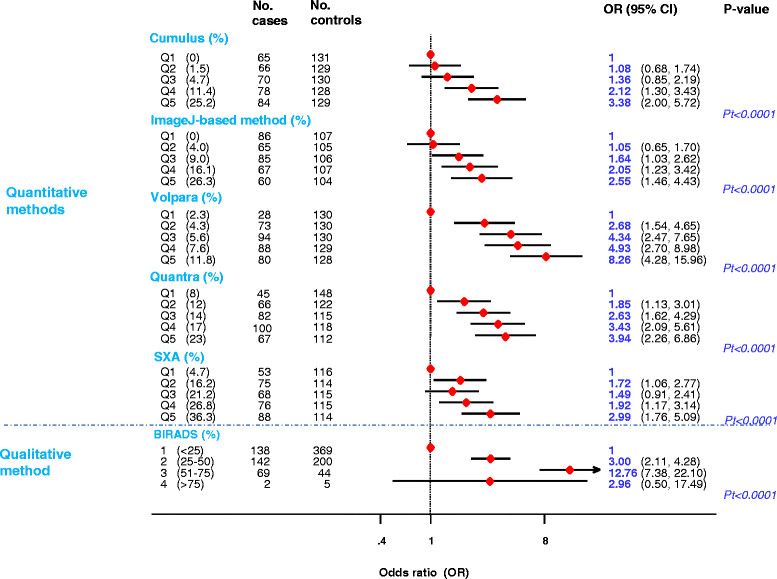
Results: Quantra and the ImageJ-based approach failed to produce readings for 4% and 11% of the participants. All six density assessment methods showed that percent density (PD) was inversely associated with age, BMI, being parous and postmenopausal at mammography. PD was positively associated with breast cancer for all methods, but with the increase in risk per standard deviation increment in PD being highest for Volpara (1.83; 95% CI: 1.51 to 2.21) and Cumulus (1.58; 1.33 to 1.88) and lower for the ImageJ-based method (1.45; 1.21 to 1.74), Quantra (1.40; 1.19 to 1.66) and SXA (1.37; 1.16 to 1.63). Women in the top PD quintile (or BI-RADS 4) had 8.26 (4.28 to 15.96), 3.94 (2.26 to 6.86), 3.38 (2.00 to 5.72), 2.99 (1.76 to 5.09), 2.55 (1.46 to 4.43) and 2.96 (0.50 to 17.5) times the risk of those in the bottom one (or BI-RADS 1), respectively, for Volpara, Quantra, Cumulus, SXA, ImageJ-based method, and BI-RADS (P for trend <0.0001 for all). The ImageJ-based method had a slightly higher ability to discriminate between cases and controls (area under the curve (AUC) for PD = 0.68, P = 0.05), and Quantra slightly lower (AUC = 0.63; P = 0.06), than Cumulus (AUC = 0.65).

Conclusions: Fully-automated methods are valid alternatives to the labour-intensive "gold standard" Cumulus for quantifying density in FFDM. The choice of a particular method will depend on the aims and setting but the same approach will be required for longitudinal density assessments.


Figures

Figure 1
Figure 1
Flowchart detailing the recruitment of study participants.aImages from both breasts in controls, and from the unaffected contralateral breast only for cases. bPercentage of women with missing readings. AD, absolute area or volume of dense tissue; AND, absolute area or volume of non-dense tissue; BS, breast size (area or volume); BC, breast cancer; FA, fully-automated method; OCa, ovarian cancer; PD, percent density; SA, semi-automated method; VA, visual assessment.
Figure 2
Figure 2
Distribution of control participants by BI-RADS categories and percent density (PD) values yielded by each quantitative method. *Density readings taken on the left cranio-caudal view (CC) except for BI-RADS, for which the four breasts/views were used to provide a single score per woman, and Quantra, which aggregated data from the CC and medio-lateral oblique view to provide a single measurement per breast.
Figure 3
Figure 3
Mutually-adjusted associations of known determinants of mammographic density with percent density (PD) readings in control women. PD readings are the mean of four breast/view readings per woman (except for Quantra and single x-ray absorptiometry - see Methods). BMI, body mass index; HT, hormonal therapy; OC, oral contraceptives; Pt, P for linear trend.
Figure 4
Figure 4
Breast cancer risk by fifths of percent density for each quantitative method, and by BI-RADS categories. Fifths of percent density risk were defined by quintiles of the density distributions among controls. Pt, P for linear trend; OR, odds ratio; SXA, single energy x-ray absorptiometry.
Figure 5
Figure 5
Breast cancer risk by fifths of absolute density and non-density for each quantitative method as defined by quintiles of the distributions in controls. OR, odds ratio; Pt, P for linear trend; SXA, single energy x-ray absorptiometry.
Figure 6
Figure 6
Breast cancer risk associated with aggregated scores produced by combining readings from two fully-automated volumetric methods. *Aggregated categories based on tertiles as defined among control women: 1: if classified in the bottom tertile (T1) by both methods; 2: if classified in T1 by one method but in the middle tertile (T2) by the other; 3: if classified in T1 by one method but in the top tertile (T3) by the other, or in T2 by both methods, or in T2 by one method but in T3 by the other; 4: if classified in T3 by both methods. OR, odds ratio; Pt, P for linear trend; SXA, single energy x-ray absorptiometry.

References

    1. Boyd NF, Rommens JM, Vogt K, Lee V, Hopper JL, Yaffe MJ, Paterson AD. Mammographic breast density as an intermediate phenotype for breast cancer. Lancet Oncol. 2005;6:798–808. doi: 10.1016/S1470-2045(05)70390-9. - DOI - PubMed
    1. McCormack VA, dos Santos SI. Breast density and parenchymal patterns as markers of breast cancer risk: a meta-analysis. Cancer Epidemiol Biomarkers Prev. 2006;15:1159–1169. doi: 10.1158/1055-9965.EPI-06-0034. - DOI - PubMed
    1. Boyd NF, Guo H, Martin LJ, Sun L, Stone J, Fishell E, Jong RA, Hislop G, Chiarelli A, Minkin S, Yaffe MJ. Mammographic density and the risk and detection of breast cancer. N Engl J Med. 2007;356:227–236. doi: 10.1056/NEJMoa062790. - DOI - PubMed
    1. Mandelson MT, Oestreicher N, Porter PL, White D, Finder CA, Taplin SH, White E. Breast density as a predictor of mammographic detection: comparison of interval- and screen-detected cancers. J Natl Cancer Inst. 2000;92:1081–1087. doi: 10.1093/jnci/92.13.1081. - DOI - PubMed
    1. BI-RADS Mammography Breast Imaging Atlas. 2003, American College of Radiology, Reston, Va

Publication types