. 2014 Nov 15;592(22):4911-29.
doi: 10.1113/jphysiol.2014.280719. Epub 2014 Sep 19.

Components of action potential repolarization in cerebellar parallel fibres

Affiliations

Components of action potential repolarization in cerebellar parallel fibres

Dobromila Pekala et al. J Physiol. .

Abstract

Repolarization of the presynaptic action potential is essential for transmitter release, excitability and energy expenditure. Little is known about repolarization in thin, unmyelinated axons forming en passant synapses, which represent the most common type of axons in the mammalian brain's grey matter.We used rat cerebellar parallel fibres, an example of typical grey matter axons, to investigate the effects of K(+) channel blockers on repolarization. We show that repolarization is composed of a fast tetraethylammonium (TEA)-sensitive component, determining the width and amplitude of the spike, and a slow margatoxin (MgTX)-sensitive depolarized after-potential (DAP). These two components could be recorded at the granule cell soma as antidromic action potentials and from the axons with a newly developed miniaturized grease-gap method. A considerable proportion of fast repolarization remained in the presence of TEA, MgTX, or both. This residual was abolished by the addition of quinine. The importance of proper control of fast repolarization was demonstrated by somatic recordings of antidromic action potentials. In these experiments, the relatively broad K(+) channel blocker 4-aminopyridine reduced the fast repolarization, resulting in bursts of action potentials forming on top of the DAP. We conclude that repolarization of the action potential in parallel fibres is supported by at least three groups of K(+) channels. Differences in their temporal profiles allow relatively independent control of the spike and the DAP, whereas overlap of their temporal profiles provides robust control of axonal bursting properties.


Figures

Figure 1
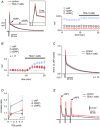
Figure 1. Axonal bursts detected at the granule cell soma
A, schematic representation of a granule cell with axon [parallel fibre (PF)] showing the position of stimulation (Stim, red) and intracellular recording (Rec, blue) electrodes. B, five somatically recorded action potentials in response to axonal activation, with slow depolarized after-potential (DAP). C, one of the 19 neurons that burst in response to axonal activation, showing typical small humps or spikelets intermingled with larger spikes. D, antidromic somatic spikes recorded from the soma at potentials of −67 mV (black), −71 mV (red) and −82 mV (blue). The fast part of the spike failed at −71 mV and −82 mV. The stimulus artefacts here, in D–G and in I were truncated. E, at the same stimulation strength the attenuated spike (blue in D) could flip between failure and its full amplitude (here illustrated by three traces of each). F, the threshold for the somatic spike (Somatic T) was determined by depolarizing current injection (rightmost trace). Granule cell recording during electrical activation of PFs (as in A) showed a combination of fast spikes and spikelets, interpreted as intermittent failures (arrow) of the spike to propagate to the soma because it was hyperpolarized by current injection. The middle trace occurred spontaneously without electrical activation. G, antidromic somatic spikes before (black) and during 0.25 mm 4-AP (red). 4-AP converted a single spike response to a combination of spikes and spikelets taking off from potentials (arrow) well below Somatic T. H, at somatic potentials below Somatic T the first spike could be blocked (red trace, arrow), but the second spike in the burst remained. I, membrane potentials for the somatic thresholds (determined by injecting current at the soma) which can be compared with the membrane potentials from which the second spike or spikelet took off (meaning the first spike that was not directly activated by the stimulation electrode). These ‘second spikes’ are separated into two groups (with and without a failure of the first stimulated spike, respectively) and show that spikes could be detected at the soma at potentials well below the somatic threshold. J, measurements of resting membrane potentials (mpot, blue), peak action potential (peak AP, red) and DAP (yellow), during the transition from antidromic single spikes to bursts, during wash-in of 0.25 mm 4-AP. The first three bursts are marked red. K, the most obvious change just before the first burst occurred (dotted line) was an increase in DAP potential (yellow). Inset: after 5–10 min of 4-AP wash-in (black horizontal bar above the plot), the spikes in the burst appeared on top of a large depolarizing wave. L, the change of spike peak amplitude, DAP and membrane potential from control (before 4-AP) to the last response before the first burst. Spike peak amplitude and DAP increased significantly. **P < 0.01; ns, not significant.
Figure 2
Figure 2. Grease-gap recordings showed changes similar to those in intrasomatic recordings
A, schematic representation of a cerebellar slice with PFs showing the position of stimulation (Stim, red) and grease-gap recording (Rec, blue) electrodes. B, mean ± s.e.m. (shaded area) of the signals from 13 grease-gap experiments (black) and five granule cell somatic recordings with antidromic spikes (blue). The signals were temporally aligned to the peak of the spike before averaging. The grease-gap experiments were additionally normalized to peak cAP amplitude before averaging, and the average was scaled to overlap the transition point between fast and slow repolarization (arrow) in the intracellular recordings. Note the similar time courses of slow decays in the intracellular and grease-gap recordings. The stimulus artefacts were truncated. C, single traces of the grease-gap signal in response to electrical activation of PFs before (black) and during (blue) 0.05 mm 4-AP, and after wash-out (red). D, a higher concentration of 4-AP (0.3 mm) gave larger effects on cAP and cDAP and added a hump on cDAP. Insets in B, C and D represent signals at a higher time resolution. E, the amplitudes of cAP and cDAP (marked with an arrow and horizontal bar in C) followed during wash-in and wash-out of 0.05 mm 4-AP. F, the same parameters as in E followed during wash-in and wash-out of 0.3 mm 4-AP. G, the amplitudes of cAP and cDAP at different concentrations of 4-AP show that the effect saturated around 0.3 mm, and that cAP increased less than cDAP at concentrations of ≥0.3 mm. Note the logarithmic scale on the vertical axis. H, at high 4-AP concentrations (≥0.6 mm) the increases of cAP and cDAP were often transient. Inset with grey curves represents averages of traces during periods indicated by grey horizontal bars. I, initial increases of cAP (left) and cDAP (right) followed the same pattern as the maximal effects displayed in G, with saturation of the effects at 4-AP concentrations of ≥0.3 mm and larger increases, at the highest concentrations, of cDAP compared with cAP. J, mean ± s.e.m. (shaded) waveform of nine grease-gap experiments before (black line) and during (red line) 0.3 mm 4-AP, normalized to peak cAP amplitude during the control period. To allow for comparisons with the intrasomatic waveform during 4-AP-induced bursting (blue), we made averages from nine somatic recordings temporally shifted to align the peak of their electrically triggered spike. The averaging procedure smoothened out the intrasomatic spikes during the burst because of their variable latencies. Qualitative similarities between intrasomatic and grease-gap recordings refer to increases in amplitude in response to 4-AP of the fast depolarization (spike and cAP) as well as the slow depolarizing component (DAP and cDAP).
Figure 3
Figure 3. Effects of different extracellular K+ concentrations
A, 4 mM K+ (blue) reduced the latency to the peak of cAP but had little effect on its amplitude compared with control at 2.5 mm K+ (black). B, 6 mM K+ (red) reduced cAP latency and reduced the amplitudes of cAP and cDAP more than 4 mm K+. C, cAP latency and amplitude followed during wash-in and wash-out of different K+ concentrations: 4 mm (blue) and 6 mm (red) K+ reduced latency and cAP amplitude. The small, initial decrease of latency observed during the 10 mm K+ (grey) application was followed by an increase, as expected with depolarization large enough to inactivate voltage-sensitive Na+ channels. D, on average in six experiments latency to cAP decreased during 4 mm and 6 mm K+ as expected with moderate depolarization of membrane potential, whereas cAP amplitude declined only slightly. cAP amplitude dropped towards zero during 10 mm K+.
Figure 4
Figure 4. Effects of tetraethylammonium (TEA)
A, the grease-gap signal from one experiment before (black) and during (red) 1 mm TEA. Each curve is the average of nine individual traces. The inset in the left panel represents traces at a higher time resolution, for better visualization of changes in cAP amplitude. Right panel: TEA increased cAP (blue) amplitude more than cDAP1 (black) and cDAP2 (red) amplitudes. B, in 17 experiments the average amplitude of cAP increased more than those of cDAP1 and cDAP2 in response to 1 mm TEA. C, the parameters expressed as a fraction of control cAP amplitude (by normalizing to the peak of control cAP, black) showed that the amplitude of cAP changed much more than cDAP1 and cDAP2 in response to 1 mm TEA (red, mean ± s.e.m. of 13 experiments). D, a comparison of the effects of 1 mm and 5 mm TEA shows that most of the amplitude-increasing effect of TEA was present at 1 mm. E, the grease-gap signal from one experiment shows a train of three stimuli at 100 Hz in control conditions (black) and after 1 mm TEA (red), illustrating that TEA did not change the frequency-following ability at this moderate frequency.
Figure 7
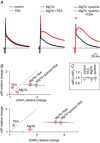
Figure 7. Summary of effects of Kv channel blockers on fast and slow components of repolarization in parallel fibres
A, summary of averaged shapes (those in Figs4C, 5D and 6E) showing that TEA mostly increased fast repolarization (red) compared with control (black). The maximal TEA effect on cAP was similar when combined with margatoxin (MgTX) and with quinine, but because the amplitude of all components of the recorded signal decreased over time when MgTX, quinine and TEA were combined (Fig.6C) the maximal TEA effect on cAP is marked by a red open circle (rightmost panel), and the red trace is taken when the cDAP1/cAP ratio was close to 1.0. B, summary of the relationships between cAP and cDAP1 (upper panel), and cDAP2 (lower panel). Mean ± s.e.m. relative changes in response to TEA 1 mm, MgTx and the combinations of MgTx + TEA and MgTX + quinine + TEA are presented in detail in Figs4 and 5. C, TEA, MgTx or quinine applied alone did not change the axon's ability to follow three stimuli with 10 ms intervals, measured as the ratio of the amplitudes of the third and first cAP. These data were presented in detail earlier in this article.
Figure 5
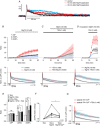
Figure 5. Effects of margatoxin (MgTX)
A, single traces of the grease-gap signal in response to electrical activation of PFs before (black) and during (red and blue) 10 nm MgTX. The amplitude of cAP changed little, whereas that of cDAP2 increased considerably during 30 min (blue). B, mean data across 10 experiments show that MgTX had little effect on cAP amplitude (blue), but increased cDAP1 and cDAP2 (black and red, respectively). The bottom panel shows the mean ± s.e.m. (shaded area) shape of the recorded potentials during control (black) and the last 3 min with MgTX (red). The stimulus artefacts were truncated. C, the introduction of 10 nm MgTX when 1 mm TEA was already present in the bath showed that cDAP1 and cDAP2 were still increasing after 25 min of MgTX treatment. The average shapes before and during MgTX (bottom panel) show changes similar to those with MgTX alone. D, the introduction of 1 mm TEA when slices had been incubated in the holding chamber with 10 nm MgTX resulted in an increase of cAP similar to that with TEA alone (Fig.4B). However, cDAP1 and cDAP2 increased faster and to a greater extent than in the experiments in B and C, as is also apparent in the average shapes (bottom panel; the stimulus artefacts were truncated). E, summary of amplitude increases of cAP, cDAP1 and cDAP2 with different combinations of blockers. (*P < 0.05; **P < 0.01; ***P ≤ 0.001; ns, not significant.) F, when cDAP2 was first increased by the combination of MgTX (10 nm) and TEA (1 mm), the amplitude could be reduced by the addition of 0.05 mm Cd2+ to the bath. (*P < 0.05.) G, combining TEA (1 mm) with MgTX (10 nm) (n = 2) or MgTx (10 nm) + DTX (100 nm) (n = 2), called peptide TX in the figure, increased the amplitude of the depolarizing after-potential also when Cd2+ (0.1 or 0.2 mm) was present in the bath from the beginning of the experiment. The stimulus artefacts were truncated.
Figure 6
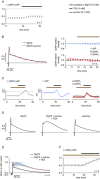
Figure 6. Effects of quinine (0.1 mM) on slices incubated with margatoxin (MgTX) (10 nM)
A, most of the fast repolarization remained even when 1 mm TEA was added to slices incubated with MgTX, as shown by only modest changes in ratio between cDAP1 and cAP (n = 7). B, quinine (yellow horizontal bar) applied to PFs incubated with MgTX did not change cAP, cDAP1 or cDAP2. The shape of the grease-gap signal is the average of nine traces before (black) and during quinine (red) from a single experiment (left). The parameters were followed over 25 min and displayed as the average of five experiments (right). C, the addition of quinine (yellow horizontal bar) to slices incubated with MgTX did not change the cDAP1/cAP ratio, cAP, cDAP1 or cDAP2, but the subsequent addition of TEA (black horizontal bar) increased all of these parameters, and most importantly brought the cDAP1/cAP ratio close to 1.0, meaning fast repolarization was abolished. The amplitudes of cAP, cDAP1 and cDAP2 decreased a few minutes after TEA was introduced, probably as a result of membrane depolarization, but was largely restored in solution without Kv blockers. D, representative traces from the period with only MgTX, MgTX + quinine + TEA, and washout, from the experiment used in C. Note the smaller cAP peak in the middle trace, probably caused by membrane depolarization, but at the same time a greatly reduced fast repolarization that was never observed in experiments with K+-induced depolarization as in Fig.3. E, the mean ± s.e.m. (shaded area) shape of grease-gap recorded potential from five experiments in which only MgTX-sensitive channels were blocked (black) and after subsequent addition of quinine and TEA (red). The individual experiments were normalized to the peak cAP before quinine and TEA were added. The stimulus artefacts were truncated. F, when 1 mm TEA was added after quinine (MgTX-incubated slices) the fast repolarization was almost completely blocked as shown by the cDAP1/cAP ratio approaching 1.0 (n = 5).

Similar articles

Cited by

References

    1. Amir R, Kocsis JD, Devor M. Multiple interacting sites of ectopic spike electrogenesis in primary sensory neurons. J Neurosci. 2005;25:2576–2585. &. - PMC - PubMed
    1. Atluri PP, Regehr WG. Delayed release of neurotransmitter from cerebellar granule cells. J Neurosci. 1998;18:8214–8227. &. - PMC - PubMed
    1. Blanton MG, Lo Turco JJ, Kriegstein AR. Whole cell recording from neurons in slices of reptilian and mammalian cerebral cortex. J Neurosci Methods. 1989;30:203–210. &. - PubMed
    1. Bostock H, Campero M, Serra J, Ochoa J. Velocity recovery cycles of C fibres innervating human skin. J Physiol. 2003;553:649–663. &. - PMC - PubMed
    1. Braitenberg V, Schüz A. Cortex: Statistics and Geometry of Neuronal Connectivity. Berlin: Springer; 1998. , &.

Publication types

Substances

LinkOut - more resources