. 2014 Nov 14;289(46):31792-31804.
doi: 10.1074/jbc.M114.573246. Epub 2014 Sep 19.

Hu antigen R (HuR) is a positive regulator of the RNA-binding proteins TDP-43 and FUS/TLS: implications for amyotrophic lateral sclerosis

Affiliations

Hu antigen R (HuR) is a positive regulator of the RNA-binding proteins TDP-43 and FUS/TLS: implications for amyotrophic lateral sclerosis

Liang Lu et al. J Biol Chem. .

Abstract

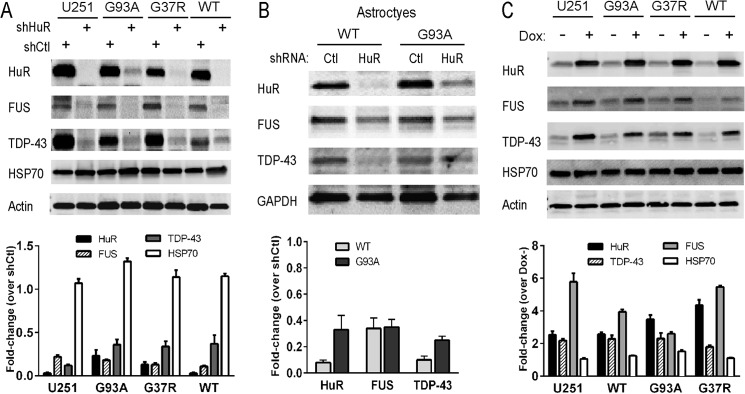
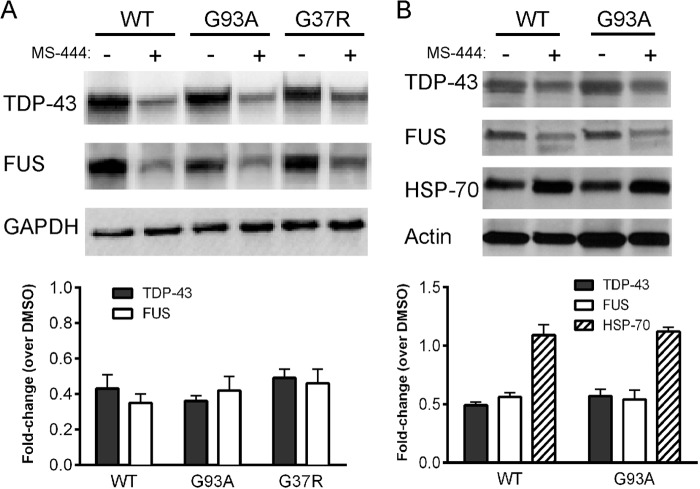
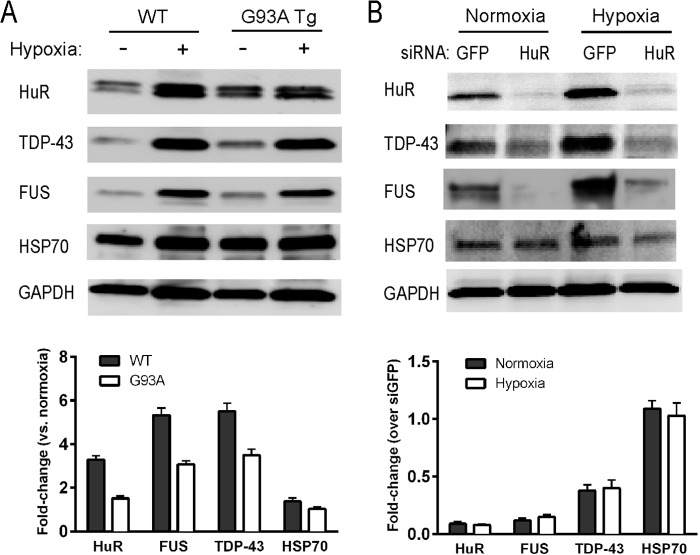
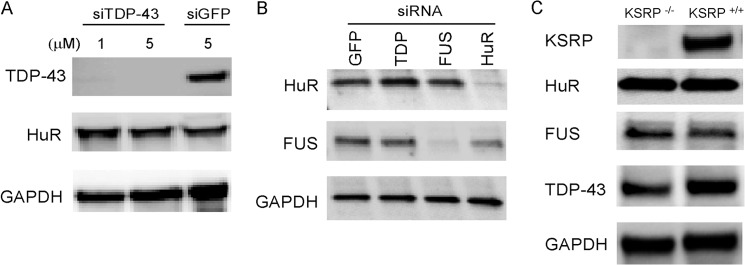
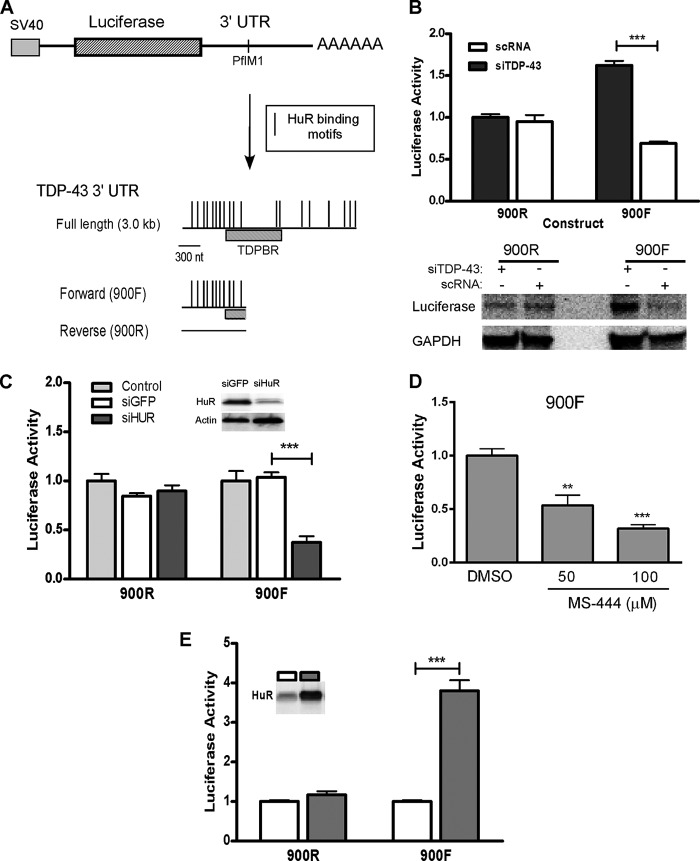
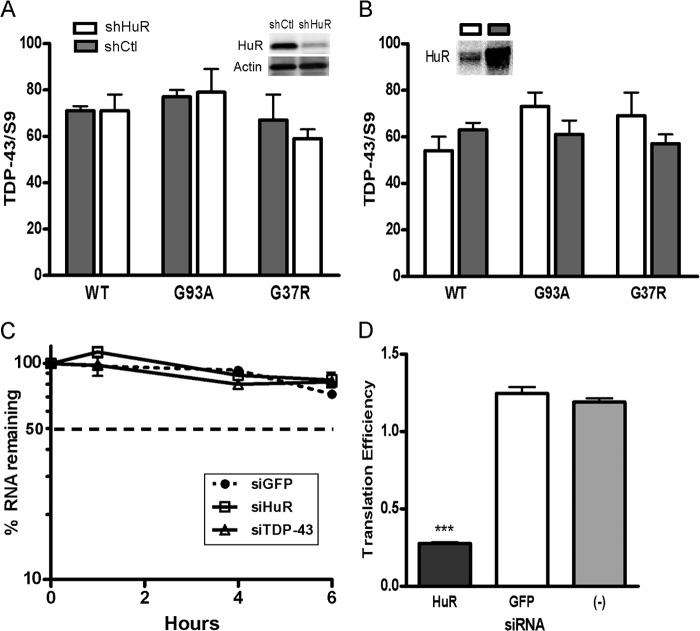
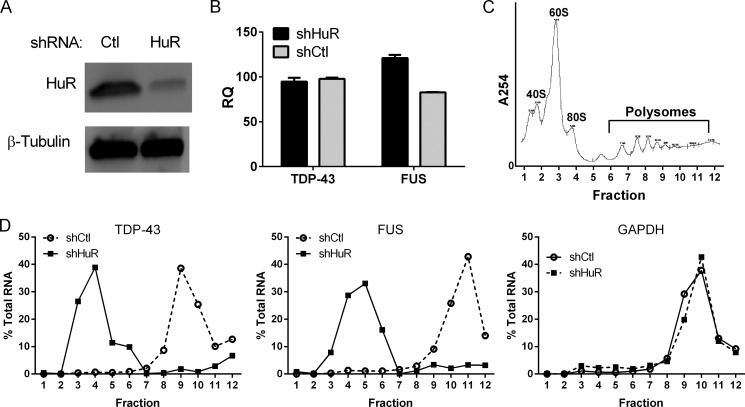
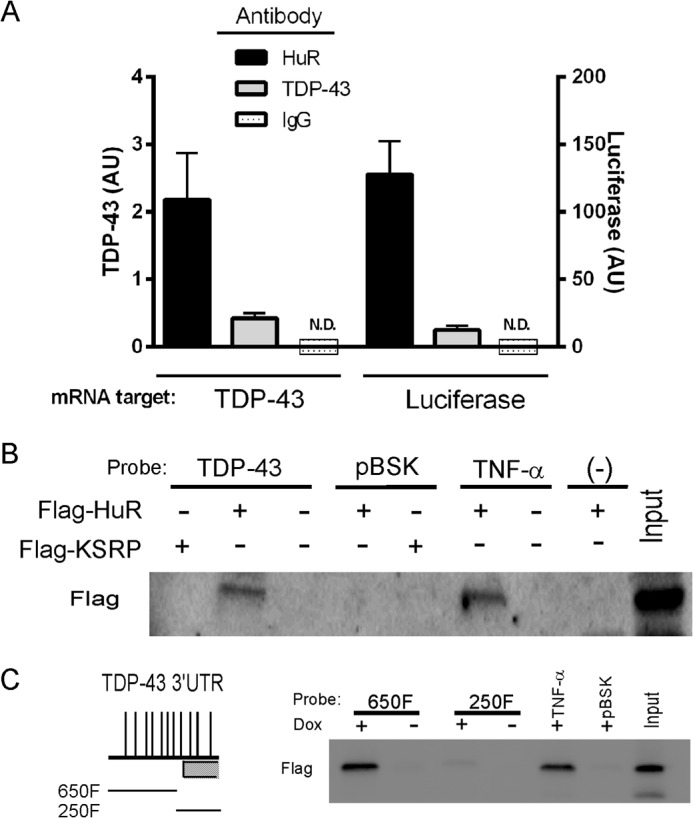
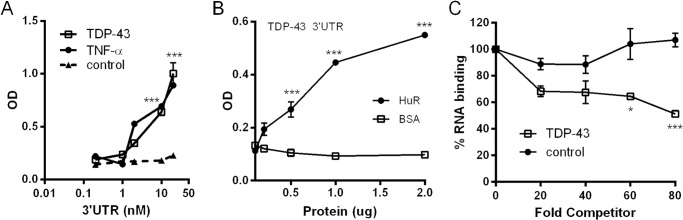
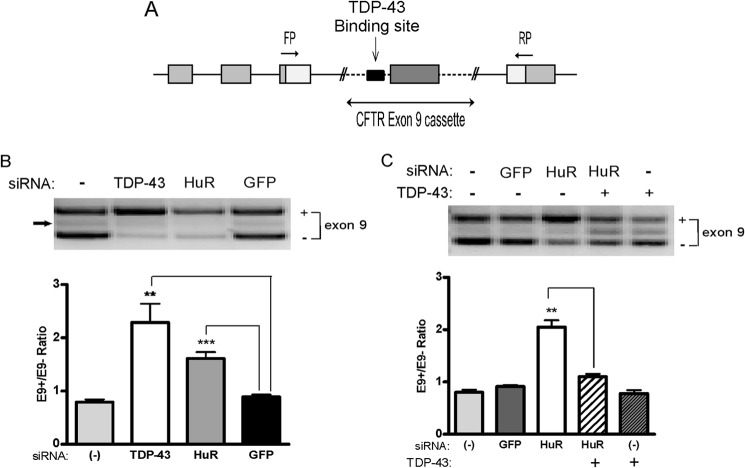
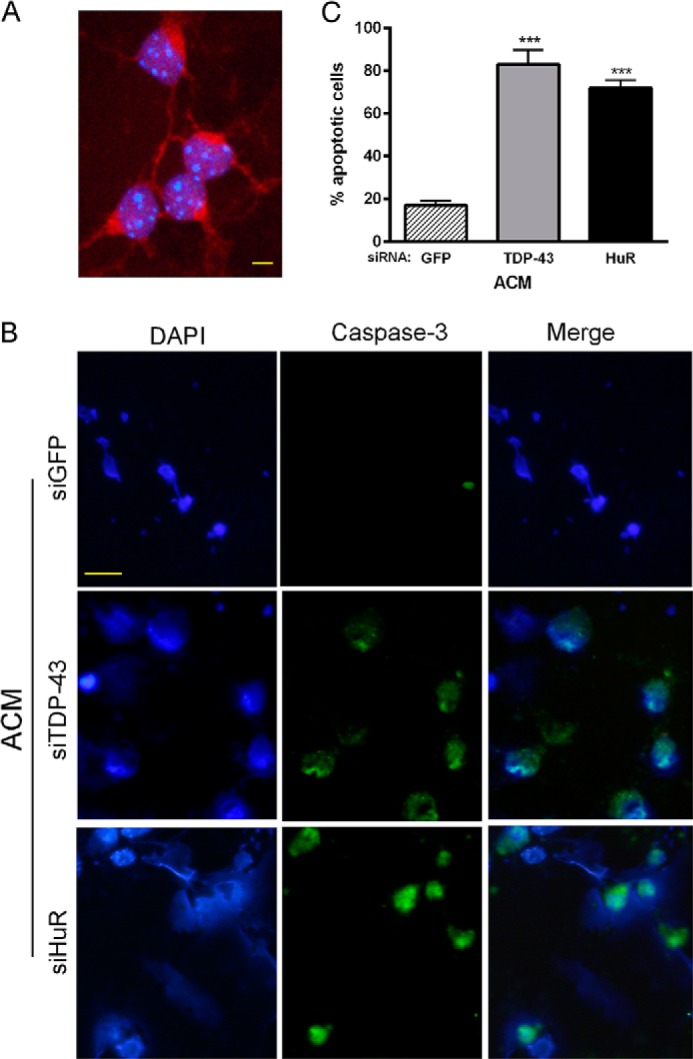
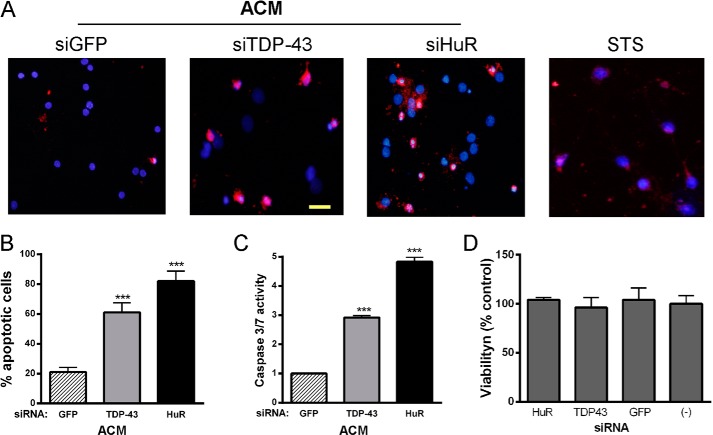
Posttranscriptional gene regulation is governed by a network of RNA-binding proteins (RBPs) that interact with regulatory elements in the mRNA to modulate multiple molecular processes, including splicing, RNA transport, RNA stability, and translation. Mounting evidence indicates that there is a hierarchy within this network whereby certain RBPs cross-regulate other RBPs to coordinate gene expression. HuR, an RNA-binding protein we linked previously to aberrant VEGF mRNA metabolism in models of SOD1-associated amyotrophic lateral sclerosis, has been identified as being high up in this hierarchy, serving as a regulator of RNA regulators. Here we investigated the role of HuR in regulating two RBPs, TDP-43 and FUS/TLS, that have been linked genetically to amyotrophic lateral sclerosis. We found that HuR promotes the expression of both RBPs in primary astrocytes and U251 cells under normal and stressed (hypoxic) conditions. For TDP-43, we found that HuR binds to the 3' untranslated region (UTR) and regulates its expression through translational efficiency rather than RNA stability. With HuR knockdown, there was a shift of TDP-43 and FUS mRNAs away from polysomes, consistent with translational silencing. The TDP-43 splicing function was attenuated upon HuR knockdown and could be rescued by ectopic TDP-43 lacking the 3' UTR regulatory elements. Finally, conditioned medium from astrocytes in which HuR or TDP-43 was knocked down produced significant motor neuron and cortical neuron toxicity in vitro. These findings indicate that HuR regulates TDP-43 and FUS/TLS expression and that loss of HuR-mediated RNA processing in astrocytes can alter the molecular and cellular landscape to produce a toxic phenotype.

Keywords: 3′ Untranslated Region; Amyotrophic Lateral Sclerosis (ALS) (Lou Gehrig Disease); Astrocyte; Neuron; RNA Processing; RNA Splicing.


Figures

FIGURE 1.
FIGURE 1.
HuR promotes TDP-43 and FUS/TLS expression. A and B, Western blot analysis of cell extracts following shRNA-mediated silencing of HuR in U251 parent cells and U251 SOD1 clones (A) and primary astrocytes from WT or G93A SOD1 mutant mice (B). Ctl, control. C, Western blot of U251 clones (and parent cell line) constitutively expressing forms of SOD1 in which HuR is induced with doxycycline treatment. Antibodies are shown to the left of each blot. Quantitative densitometry is shown below each blot. Bands for the proteins were normalized to GAPDH or actin and then expressed as a fold change over the control (either siCtl for knockdown or doxycycline (Dox) for overexpression of HuR). Results are representative of three independent experiments.
FIGURE 2.
FIGURE 2.
The HuR inhibitor MS-444 attenuates TDP-43 and FUS/TLS expression. A and B, Western blot analysis of wild-type and mutant SOD1 U251 clones (A) or cortical astrocytes (B) after treatment with MS-444 for 24 h (50 μm for astrocytes and 100 μm for U251 clones). Antibodies are shown to the left. Bottom panels, densitometric quantification of bands shown in the blots. Values for each protein were adjusted to the loading controls (GAPDH or actin) and are shown as a fold change over dimethyl sulfoxide (DMSO) vehicle control. The results are representative of three independent experiments.
FIGURE 3.
FIGURE 3.
Hypoxia induction of TDP-43 and FUS/TLS is blocked with HuR silencing. A, primary astrocytes from WT or G93A mice were subjected to 1% O2 or normoxic conditions for 48 h and assessed by Western blot analysis. Antibodies are shown to the left of the blots. B, primary astrocytes were treated with siHuR or siGFP (control) RNAs and subjected to hypoxic conditions as in A. Bottom panels, quantitative densitometry was calculated as described in Fig. 1. Results are representative of three independent experiments.
FIGURE 4.
FIGURE 4.
Knockdown of TDP-43, FUS/TLS, or KSRP does not affect HuR or other RBP expression in astrocytes. A, Western blot analysis of primary astrocytes after transfection with TDP-43 or control (siGFP) siRNAs. B, astrocytes were knocked with the siRNA shown, and extracts were assessed for HuR or FUS/TLS expression. C, extracts were prepared from KSRP−/− and KSRP+/+ (littermate) mouse astrocytes and assessed by Western blot analysis. Antibodies are shown to the left of the blots.
FIGURE 5.
FIGURE 5.
HuR Regulates TDP-43 via the 3UTR. A, schematic of the luciferase reporter constructs used to assess the TDP-43 3′ UTR. The portion of the 3′UTR (900F) used in these experiments was cloned downstream of the luciferase coding region at the PflM1 site. Potential HuR binding sites are shown below (33, 34). A fragment representing the reverse complement (900R) was used as a control. TDPBR, TDP-43 binding region as defined by Ayala et al. (35). B, top panel, luciferase constructs were transfected into U251 cells along with TDP-43 or control siRNA. Luciferase activity was normalized to an internal transfection control (β-galactosidase). Bottom panel, Western blot analysis of protein extract from the same transfection experiment. C, the same as B, except HuR was knocked down with siRNA. Some cells (control) were not treated with any siRNA. D, U251 cells were transfected with the 900F construct and treated with vehicle (dimethyl sulfoxide (DMSO)) or MS-444 at the doses shown for 24 h. E, luciferase constructs were transfected into a U251 clone that can be induced to express HuR with doxycycline treatment (shaded boxes). Luciferase activity was normalized to the internal transfection control. All results are mean ± S.E. of at least three independent tests. **, p < 0.005; ***, p < 0.001.
FIGURE 6.
FIGURE 6.
HuR does not affect TDP-43 mRNA expression or stability but suppresses translational efficiency. A and B, HuR was knocked down (A) or overexpressed (B) in U251 clones as indicated, and TDP-43 mRNA was measured by qRT-PCR and expressed as a percentage of the housekeeping gene S9. C, analysis of TDP-43 mRNA decay in U251 cells after transfection with siRNA to TDP-43, HuR, or GFP. Cells were treated with actinomycin D for the time interval indicated, followed by measurement of TDP-43 mRNA levels. RNA values are expressed as a percentage of the baseline value prior to actinomycin D treatment (time 0). D, the 900F luciferase construct (Fig. 5A) and a β-galactosidase control were transfected into U251 cells along with siRNA to HuR, GFP, or no siRNA (−). Luciferase and β-galactosidase activity and mRNA levels were measured, and translational efficiency was calculated by the following equation: [Luciferase activity / Luciferase mRNA] / [β-galactosidase activity / β-galactosidase mRNA] (see “Experimental Procedures”). All data points represent the mean ± S.E. of at least three independent tests. ***, p < 0.0005.
FIGURE 7.
FIGURE 7.
HuR knockdown leads to shift of TDP-43 and FUS/TLS away from polysomes. A, Western blot analysis showing knockdown of HuR in U251 cells versus shControl (Ctl) prior to polysome fractionation. B, qRT-PCR showing total mRNA levels of TDP-43 and FUS/TLS after HuR knockdown. C, representative absorbance profile of cytoplasmic extract fractionated by sucrose gradient. D, percent distribution of TDP-43, FUS/TLS, and GAPDH mRNA in the fractions. RNA was quantitated by qRT-PCR. The experiment was repeated one time with similar results. RQ, relative quantity.
FIGURE 8.
FIGURE 8.
HuR binds to the TDP-43 3UTR. A, U251MG cell extracts were subjected to RNA immunoprecipitation (RNA-IP) with the antibodies shown, and TDP-43 mRNA in the precipitate was quantified by qRT-PCR. U251 cells were also transfected with the 900F TDP-43 3′ UTR luciferase construct (Fig. 5) and immunoprecipitated with the same antibodies, and luciferase mRNA was quantified in the precipitate. AU, arbitrary units; ND, not detected. B, U251 MG cells were transiently transfected with FLAG-HuR or FLAG-KSRP expression plasmids, and lysates were incubated with biotin-labeled 3′UTR RNA probes for TDP-43, TNF-α, pBSK (control), or no probe (−) as shown. The extracts were precipitated with streptavidin beads and assessed by Western blot analysis using the antibodies shown on the left. C, the U251 doxycycline (Dox)-inducible FLAG-HuR clone was induced with doxycycline, and lysates were incubated with biotinylated TDP-43 3′ UTR probes derived from 900F (schematically shown to the left, see Fig. 5) and immunoprecipitated as in B.
FIGURE 9.
FIGURE 9.
Recombinant HuR binds to the TDP-43 3UTR. An ELISA-based RNA-binding assay was used to assess RNA binding (see “Experimental Procedures” and Ref. 26). With HuR affixed to the ELISA well, the binding reaction was initiated by addition of a biotinylated TDP-43, TNF-α 3′UTR, or control riboprobe. A, HuR binds to TDP-43 3′ UTR similarly as to the TNF-α 3′ UTR. B, HuR binding is protein concentration-dependent. Varying amounts of HuR or control protein (BSA) was adsorbed to the ELISA well prior to the RNA binding reaction. C, addition of unlabeled TDP43 3′ UTR, but not a control riboprobe, inhibits binding. All data represent the mean ± S.E. of three independent measurements. *, p < 0.01; ***, p < 0.001.
FIGURE 10.
FIGURE 10.
Knockdown of HuR induces CFTR exon 9 skipping. A, schematic of the hybrid minigene containing CFTR exon 9 and its flanking introns. FP, forward primer; RP, reverse primer. B, the CFTR hybrid minigene was cotransfected with TDP-43, HuR, or control GFP siRNA into U251 cells, and the mRNA was assessed by RT-PCR for exon 9 splicing. A representative image is shown. The arrow depicts an aberrant splicing product from a cryptic 3′ splice site as previously described (40). Bottom panel, densitometric quantification of bands shown as a ratio of exon 9 inclusion (+) to exclusion (−). C, rescue study showing that transfection of a TDP-43 expression plasmid lacking regulatory elements in the 3′ UTR can reverse the splicing defect caused by HuR knockdown. Data points represent the mean ± S.E. of five independent tests. **, p < 0.01; ***, p < 0.001. The efficiency of HuR or TDP-43 knockdown was monitored by Western blot analysis.
FIGURE 11.
FIGURE 11.
Conditioned medium from HuR and TDP-43 knockdown astrocytes is toxic to motor neurons. A, cultured motor neurons used in the assay were stained with choline acetyltransferase antibody (red) to verify purity. DAPI staining (blue) was used to identify nuclei. Scale bar = 20 μm. B, motor neurons were incubated with conditioned medium from astrocytes (ACM) in which TDP-43 or HuR was knocked down or transfected with the GFP control siRNA. Cells were fixed and stained for cleaved caspase 3 (green) and DAPI (blue). Scale bar = 50 μm. C, cells positive for cleaved caspase 3 staining were scored by a blinded observer and expressed as a percentage of total cells. Data points are the mean ± S.E. of 10 high-power fields from three independent experiments. ***, p < 0.001 compared with the siGFP control.
FIGURE 12.
FIGURE 12.
Conditioned medium from HuR and TDP-43 knockdown astrocytes is toxic to cortical neurons but not astrocytes. A, cortical neurons were incubated with conditioned medium from astrocytes (ACM) in which TDP-43 or HuR was knocked down or were transfected with the GFP control siRNA. Cells were fixed and stained for cleaved caspase 3 (red) and DAPI (blue). STS, staurosporine. Scale bar = 50 μm. B, cells positive for cleaved caspase 3 staining were scored by a blinded observer and expressed as a percentage of total cells. Data points are the mean ± S.E. of 10 high-power fields from three independent experiments. C, caspase 3 and 7 activity in cortical neurons was measured directly in the tissue culture well after incubation with the ACM (siGFP was set at 1). D, astrocyte viability after siRNA transfection was assessed by an ATP-based assay. ***, p < 0.001 compared with siGFP control.

Similar articles

Cited by

References

    1. Robberecht W., Philips T. (2013) The changing scene of amyotrophic lateral sclerosis. Nat. Rev. Neurosci. 14, 248–264 - PubMed
    1. Buratti E., Baralle F. E. (2011) TDP-43: new aspects of autoregulation mechanisms in RNA binding proteins and their connection with human disease. FEBS J. 278, 3530–3538 - PubMed
    1. Zhou Y., Liu S., Liu G., Oztürk A., Hicks G. G. (2013) ALS-associated FUS mutations result in compromised FUS alternative splicing and autoregulation. PLoS Genet. 9, e1003895. - PMC - PubMed
    1. Huelga S. C., Vu A. Q., Arnold J. D., Liang T. Y., Liu P. P., Yan B. Y., Donohue J. P., Shiue L., Hoon S., Brenner S., Ares M., Jr., Yeo G. W. (2012) Integrative genome-wide analysis reveals cooperative regulation of alternative splicing by hnRNP proteins. Cell Rep. 1, 167–178 - PMC - PubMed
    1. Pullmann R., Jr., Kim H. H., Abdelmohsen K., Lal A., Martindale J. L., Yang X., Gorospe M. (2007) Analysis of turnover and translation regulatory RNA-binding protein expression through binding to cognate mRNAs. Mol. Cell Biol. 27, 6265–6278 - PMC - PubMed

Publication types

MeSH terms