. 2015 Jan;36(1):2-12.
doi: 10.1093/carcin/bgu202. Epub 2014 Sep 19.

The role of miR-200a in mammalian epithelial cell transformation

Affiliations

The role of miR-200a in mammalian epithelial cell transformation

Lindsey E Becker et al. Carcinogenesis. 2015 Jan.

Abstract

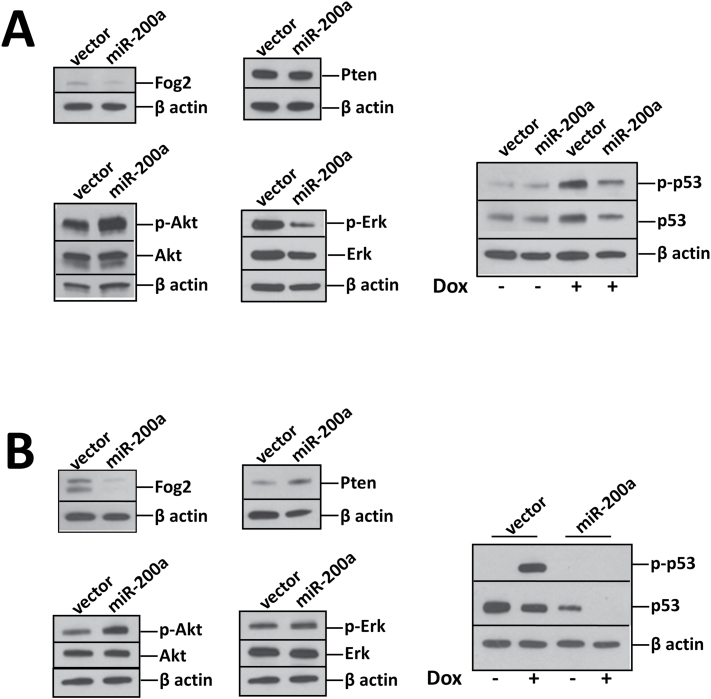
Cancer is a multistep disease that begins with malignant cell transformation and frequently culminates in metastasis. MicroRNAs (miRNAs) are small regulatory 21-25 nt RNA molecules and are frequently deregulated in cancer. miR-200a is a member of the miR-200 family, which are known inhibitors of the epithelial-to-mesenchymal transition. As such, the tumor-suppressive role of miR-200a in oncogenesis has been well documented; however, recent studies have found a proliferative role for this miRNA as well as a prometastatic role in the later steps of cancer progression. Little is known about the role of this miRNA in the early stages of cancer, namely, malignant cell transformation. Here, we show that miR-200a alone transforms an immortalized rat epithelial cell line, and miR-200a cooperates with Ras to enhance malignant transformation of an immortalized human epithelial cell line. Furthermore, miR-200a induces cell transformation and tumorigenesis in immunocompromised mice by cooperating with a Ras mutant that activates only the RalGEF effector pathway, but not Ras mutants activating PI3K or Raf effector pathways. This transformative ability is in accordance with miR-200a targeting Fog2 and p53 to activate Akt and directly repress p53 protein levels, respectively. These results demonstrate an oncogenic role for miR-200a and provide a specific cellular context where miR-200a acts as an oncomiR rather than a tumor suppressor by cooperating with an oncogene in malignant cell transformation.


Figures

Fig. 1.
Fig. 1.
miR-200a transforms RK3E cells and stimulates Akt activity but maintains an epithelial phenotype. (A) Schematic of foci formation induced by transient transfection of RK3E cells with individual miRNAs from a library of 366 miRNA minigenes. Cells were visually inspected for foci formation in cell culture. (B) Phase contrast microscopy of three dimensional colonies formed in soft agar by RK3E cells stably overexpressing the indicated miRNAs. A total of 5000 cells per well were plated in 0.2% soft agar in six well plates. (C) Subcutaneous tumor formation of RK3E cells overexpressing the indicated miRNAs. Cells (1×10⁶) were resuspended in Matrigel and injected subcutaneously (n = 5 per group). (D) Left: western blot for the mesenchymal marker Vimentin and the epithelial marker E-cadherin in RK3E cells lentivirally infected with miR-200a or empty vector control. Right: western blot for members of the Akt activation pathway in RK3E cells. (E) Immunofluorescent staining of RK3E tumors; left: E-cadherin expression (green) and right: Vimentin (green) expression.
Fig. 2.
Fig. 2.
miR-200a synergizes with Ras to transform MCF10A cells and inhibit apoptosis. (A) Soft agar colony formation: bright field microscopy of MCF10A cells stably infected with the indicated oncogenes alone (left panels) or in combination with miR-200a (right panels). A total of 4000 cells per well were plated in 0.2% soft agar in six well plates in triplicate. (B) Quantification of soft agar colony formation in A. (C) Cell cycle analysis of MCF10A cells infected with the indicated oncogenes alone or in combination with miR-200a. Cells were stained with propidium iodide and a minimum of 10000 cells per group were analyzed in triplicate by flow cytometry. P values calculated for cell cycle progression out of G1 phase (green bars). (D) Apoptosis assay of MCF10A cells expressing miR-200a and Ras alone or in combination, treated with vehicle control or doxorubicin. (E) Cell proliferation curve of MCF10A cells infected with miR-200a, Ras or miR-200a in combination with Ras. Cells were plated in 96 well plates and analyzed for proliferation by MTT assay at the indicated time points. (F) Transwell cell migration of MCF10A cells infected as in D. Cells (1×10⁵) were seeded in Transwell chambers in 12 well plates in growth factor-deprived low serum media with full media in the lower well to serve as a chemoattractant. (G) Upper left: schematic of three dimensional acinus formed by MCF10A cells in Matrigel. Black line indicates equatorial confocal plane of focus. Upper right: schematic of hollow lumen visualized by confocal microscopy focused at center line depicted in left diagram. Lower: representative image of acinar structures formed by MCF10A stably infected with vector control after 14 days. (H) Three dimensional acinar formation after 5 days in Matrigel of MCF10A cells infected as in E, stained for E-cadherin (green, upper panels) and cleaved caspase-3 (red, lower panels). A total of 5000 cells were plated in 2% Matrigel in 12 well chamber slides. (I) Apoptosis assay of MCF7 cells. Cells were transfected with scrambled control or miR-200a inhibitor (anti-miR-200a) and treated with doxorubicin. Values represent means of three independent experiments ± SE. *P ≤ 0.05 compared to vector or scrambled control, P ≤ 0.05 compared to miR-200a, ¥ p ≤ 0.05 compared to Ras, § P ≤ 0.05 compared to vehicle.
Fig. 3.
Fig. 3.
miR-200a cooperates with the RalGEF Ras effector pathway to transform MCF10A cells. (A) Schematic of the main 3 effector pathways of Ras. Indicated on the leftmost arrows are the activating point mutations that allow for activation of only that pathway. (B) Soft agar colony formation assay of MCF10A cells stably infected with the indicated Ras effector mutants alone (left panels) or in combination with miR-200a (center panels) compared to constitutively activated Ras (right panel). A total of 4000 cells per well were plated in 0.2% soft agar in six well plates. (C) Quantification of soft agar colony formation in B. (D) Cell cycle analysis of MCF10A cells infected with the indicated Ras effector mutants alone or in combination with miR-200a. Cells were stained with propidium iodide and a minimum of 10000 cells per group were analyzed in triplicate by flow cytometry. P values calculated for cell cycle progression out of G1 phase (green bars). (E) Three dimensional acinar formation in Matrigel of MCF10A cells infected with the indicated Ras effector mutants, stained for E-cadherin (green, upper panels) and cleaved caspase-3 (red, lower panels). A total of 5000 cells were plated in 2% Matrigel in chamber slides. Values represent means of three independent experiments ± SE. *P ≤ 0.05 compared to vector control, P ≤ 0.05 compared to miR-200a, P ≤ 0.05 compared to E37G.
Fig. 4.
Fig. 4.
miR-200a stimulates Akt and suppresses p53 as determined by western blotting analyses. p53, Pten and Fog2 are directly targeted by miR-200a. Akt is regulated by Fog2 and Pten. Akt and Erk are Ras signaling components. (A) MCF10A cells transiently transfected with miR-200a. (B) MCF10A cells stably infected with virus carrying miR-200a.
Fig. 5.
Fig. 5.
miR-200a synergizes with the RalGEF effector pathway of Ras to induce tumorigenesis in immunocompromised mice. (A) Average tumor size in 6 week old Foxn1 nu /Foxn1 nu mice subcutaneously injected with 5×10⁵ MCF10A cells stably infected with the indicated Ras effector pathways alone or in combination with miR-200a (n = 6 per group). (B) Representative images of tumor formation. Each mouse was injected in each flank with 5×10⁵ MCF10A cells stably overexpressing a Ras effector mutant alone in one flank and 5×10⁵ MCF10A cells stably overexpressing the same Ras effector mutant in combination with miR-200a in the other flank (n = 6 for each group). (C–E) Representative H&E staining of tumors formed by E37G + miR-200a MCF10A cells showing (C) vascularization, (D) abnormal duct formation and (E) irregular tissue architecture in tumors. Tissue structures resembling human mammary histology are labeled as follows: B, blood vessel, L, loose connective tissue, D, dense connective tissue, Dt, duct.
Fig. 6.
Fig. 6.
Proposed model for the dichotomous roles of miR-200a in cancer progression. miR-200a is labeled in its oncogenic (red) or tumor suppressive (green) roles. (A) miR-200a directly targets p53 and Fog2 to promote malignant cell transformation, the initiating event of oncogenesis. Specifically, miR-200a cooperates with RalGEF to transform MCF10A cells. (B) By targeting Zeb1/2 transcription factors, miR-200a inhibits EMT. Early in metastasis, this is a tumor-suppressive function. (C) After local invasion and intravasation have occurred, promotion of MET by miR-200a enhances metastatic colonization. MET, mesenchymal-to-epithelial transition.

References

    1. Paci E., et al. (2005). Early diagnosis, not differential treatment, explains better survival in service screening. Eur. J. Cancer, 41, 2728–2734. - PubMed
    1. Sant M., et al. ; EUROCARE Working Group. (2003). EUROCARE-3: survival of cancer patients diagnosed 1990-94–results and commentary. Ann. Oncol., 14 (suppl. 5), v61–118. - PubMed
    1. Siegel R., et al. (2013). Cancer statistics, 2013. CA. Cancer J. Clin., 63, 11–30. - PubMed
    1. Chambers A.F., et al. (2002). Dissemination and growth of cancer cells in metastatic sites. Nat. Rev. Cancer, 2, 563–572. - PubMed
    1. Mcallister R.M. (1965). Viruses and cancer. Calif. Med., 102, 344–352. - PMC - PubMed

Publication types

MeSH terms

Substances