. 2014 Nov 15;307(10):H1487-96.
doi: 10.1152/ajpheart.00443.2014. Epub 2014 Sep 19.

Computational modeling of Takotsubo cardiomyopathy: effect of spatially varying β-adrenergic stimulation in the rat left ventricle

Affiliations

Computational modeling of Takotsubo cardiomyopathy: effect of spatially varying β-adrenergic stimulation in the rat left ventricle

Sander Land et al. Am J Physiol Heart Circ Physiol. .

Abstract

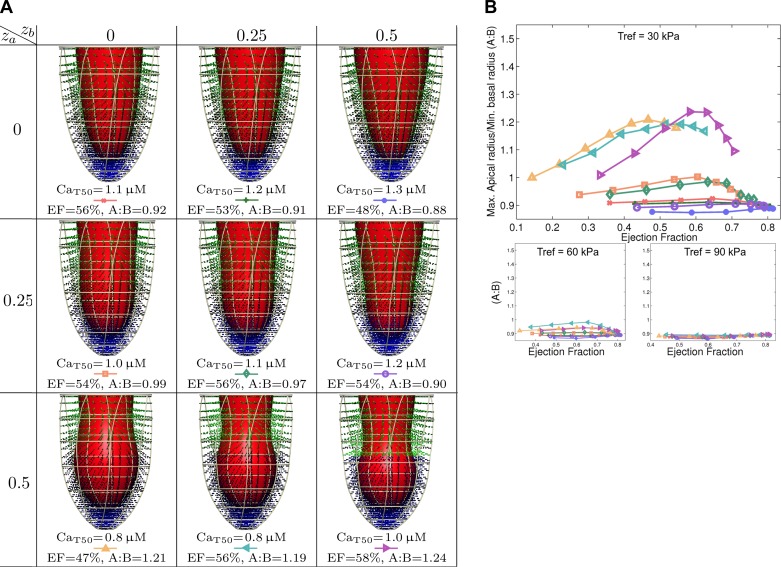
In Takotsubo cardiomyopathy, the left ventricle shows apical ballooning combined with basal hypercontractility. Both clinical observations in humans and recent experimental work on isolated rat ventricular myocytes suggest the dominant mechanisms of this syndrome are related to acute catecholamine overload. However, relating observed differences in single cells to the capacity of such alterations to result in the extreme changes in ventricular shape seen in Takotsubo syndrome is difficult. By using a computational model of the rat left ventricle, we investigate which mechanisms can give rise to the typical shape of the ventricle observed in this syndrome. Three potential dominant mechanisms related to effects of β-adrenergic stimulation were considered: apical-basal variation of calcium transients due to differences in L-type and sarco(endo)plasmic reticulum Ca(2+)-ATPase activation, apical-basal variation of calcium sensitivity due to differences in troponin I phosphorylation, and apical-basal variation in maximal active tension due to, e.g., the negative inotropic effects of p38 MAPK. Furthermore, we investigated the interaction of these spatial variations in the presence of a failing Frank-Starling mechanism. We conclude that a large portion of the apex needs to be affected by severe changes in calcium regulation or contractile function to result in apical ballooning, and smooth linear variation from apex to base is unlikely to result in the typical ventricular shape observed in this syndrome. A failing Frank-Starling mechanism significantly increases apical ballooning at end systole and may be an important additional factor underpinning Takotsubo syndrome.

Keywords: Takotsubo cardiomyopathy; cardiac modeling; catecholamine overload.


Figures

Fig. 1.
Fig. 1.
Schematic for computational methods. Shown here is the computational mesh used, the linear gradient in the variable z that defines the apex-base position for defining spatial gradients (blue to white spheres as well as the color bar on the right). Indicated on the right are the slices used for defining our maximal apical radius/minimal basal radius (A:B) metric for apical ballooning in Eq. 1. Plots on the left show the representative 6-Hz experimental rat myocyte calcium transients used to drive contraction in the computation.
Fig. 2.
Fig. 2.
Spatial gradients. The different spatial gradients used throughout this article for use in parameter variation studies. These range from a gradual linear change in parameters to 2 regions with a sharp transition. The parameter za represents the fraction of the ventricle at the apex that is minimally activated and zb the fraction of the ventricle at the base that is maximally activated. These are referred to as the size of the apical region and the size of the basal region. We define a parameter β, which varies from β = 0 at z ≤ za to β = 1 at z ≥ 1 − zb and is used to drive the variation in β-adrenergic stimulation, with a linear variation between these regions. This allows us to test both gradual changes from apex to base, e.g., za = zb = 0, as well as sharp differences as given by, e.g., za = 0.5, zb = 0.5.
Fig. 3.
Fig. 3.
Results for spatial variations in calcium transients. A: ejection fraction (EF) vs. maximal apical radius/minimal basal radius (A:B). B: details of selected results, with end-systolic geometry, calcium sensitivity (CaT50), EF, and our metric of apical ballooning (A:B). Active tension generation is visualized in the Gaussian integration points of the computational geometry. These 9 results are ordered by apical/basal regions, as in Fig. 2.
Fig. 4.
Fig. 4.
Results for spatial variations in calcium sensitivity. A: EF vs. maximal apical radius/minimal basal radius (A:B). B: details of selected results, with end-systolic geometry, calcium sensitivity (CaT50), EF, and our metric of apical ballooning (A:B).
Fig. 5.
Fig. 5.
Results for spatial variations in maximum active tension. A: EF vs. maximal apical radius/minimal basal radius (A:B). B: details of selected results.
Fig. 6.
Fig. 6.
Effect of impaired length dependence of tension. Shown are the effects of halved and fully removed length dependence on apical ballooning as measured by our “A:B” index. A reduction in the length dependence of tension generation creates a significant increases in apical ballooning in many cases.
Fig. 7.
Fig. 7.
Examples of maximal increase in end-systolic apical ballooning after a decrease in length-dependent activation (LDA). Exampled were limited to those simulations with an ejection fraction of ≥30% after the change in parameter, and chosen to represent the maximal relative increase in A:B at end systole after changing the degree of LDA. Both cases represent apical-basal variations in the calcium transient. A1 and A2: case with maximal change in the A:B metric when halving the LDA parameter from β1 = −1.5 to β1 = −0.75, which has parameters za = 0.5, zb = 0, CaT50 = 0.9 μM. B1 and B2: case with maximal change in the A:B metric when setting the LDA parameter to β1 = 0, which has parameters za = 0.25, zb = 0, CaT50 = 0.8 μM.
Fig. 8.
Fig. 8.
Effect of increased afterload. Figure shows the effects of 25 and 50% increased afterload as measured by our “A:B” index. Increased afterload is simulated by the pressure at which ejection starts, which represents the minimal aortic pressure and is given by pa = 9 kPa control, 11.25, and 13.5 kPa in the increased cases, respectively.

References

    1. Akashi YJ, Goldstein DS, Barbaro G, Ueyama T. Takotsubo cardiomyopathy a new form of acute, reversible heart failure. Circulation 118: 2754–2762, 2008. - PMC - PubMed
    1. Akashi YJ, Nef HM, Möllmann H, Ueyama T. Stress cardiomyopathy. Annu Rev Med 61: 271–286, 2010. - PubMed
    1. Bayliss CR, Jacques AM, Leung MC, Ward DG, Redwood CS, Gallon CE, Copeland O, McKenna WJ, Remedios CD, Marston SB, Messer AE. Myofibrillar Ca2+ sensitivity is uncoupled from troponin I phosphorylation in hypertrophic obstructive cardiomyopathy due to abnormal troponin T. Cardiovasc Res 97: 500–508, 2013. - PubMed
    1. Cheng H, Lederer WJ, Cannell MB. Calcium sparks: elementary events underlying excitationcontraction coupling in heart muscle. Science 262: 740–744, 1993. - PubMed
    1. Deshmukh A, Kumar G, Pant S, Rihal C, Murugiah K, Mehta JL. Prevalence of takotsubo cardiomyopathy in the united states. Am Heart J 164: 66–71, 2012. - PubMed

Publication types

MeSH terms

LinkOut - more resources