. 2014 Nov;46(11):1227-32.
doi: 10.1038/ng.3095. Epub 2014 Sep 21.

PRC2 is recurrently inactivated through EED or SUZ12 loss in malignant peripheral nerve sheath tumors

Affiliations

PRC2 is recurrently inactivated through EED or SUZ12 loss in malignant peripheral nerve sheath tumors

William Lee et al. Nat Genet. 2014 Nov.

Abstract

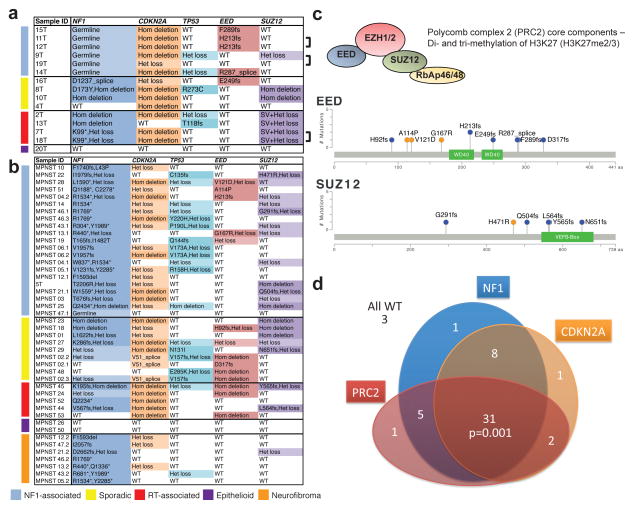
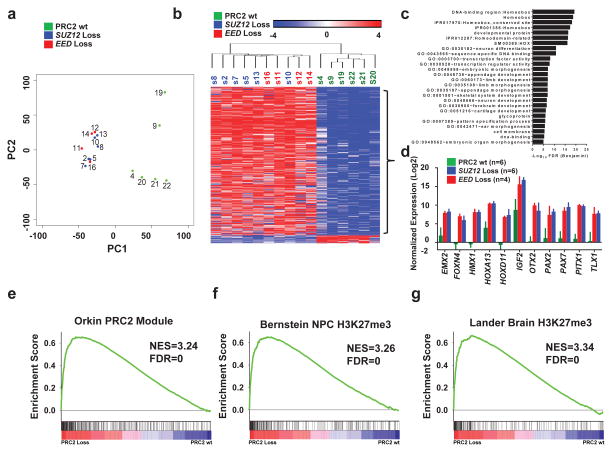
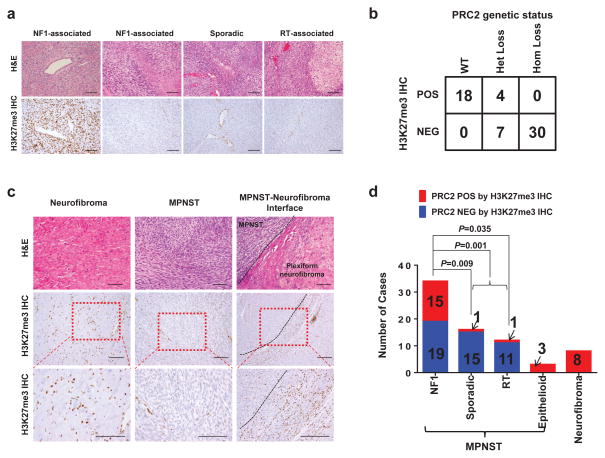
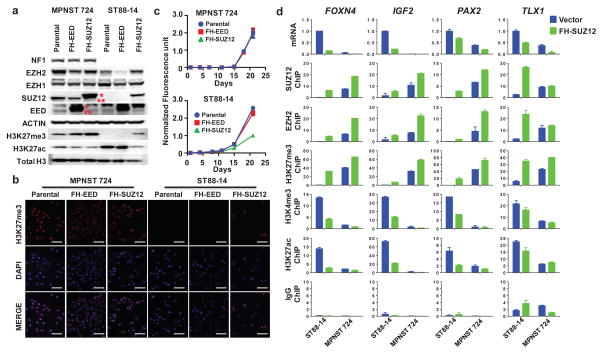
Malignant peripheral nerve sheath tumors (MPNSTs) represent a group of highly aggressive soft-tissue sarcomas that may occur sporadically, in association with neurofibromatosis type I (NF1 associated) or after radiotherapy. Using comprehensive genomic approaches, we identified loss-of-function somatic alterations of the Polycomb repressive complex 2 (PRC2) components (EED or SUZ12) in 92% of sporadic, 70% of NF1-associated and 90% of radiotherapy-associated MPNSTs. MPNSTs with PRC2 loss showed complete loss of trimethylation at lysine 27 of histone H3 (H3K27me3) and aberrant transcriptional activation of multiple PRC2-repressed homeobox master regulators and their regulated developmental pathways. Introduction of the lost PRC2 component in a PRC2-deficient MPNST cell line restored H3K27me3 levels and decreased cell growth. Additionally, we identified frequent somatic alterations of CDKN2A (81% of all MPNSTs) and NF1 (72% of non-NF1-associated MPNSTs), both of which significantly co-occur with PRC2 alterations. The highly recurrent and specific inactivation of PRC2 components, NF1 and CDKN2A highlights their critical and potentially cooperative roles in MPNST pathogenesis.


Conflict of interest statement

COMPETING FINANCIAL INTERESTS

The authors declare no competing financial interests.

Figures

Figure 1
Figure 1. Most frequent genetic alterations in MPNSTs (NF1-associated, sporadic, radiotherapy-associated and epithelioid) and neurofibromas
(a, b) Non-synonymous single nucleotide variants (SNVs) and copy number variants (CNVs) in 15 MPNSTs with matched normal pairs by WES, SNP6.0 and RNA-seq (a), and in 37 MPNSTs and 7 neurofibromas by targeted sequencing (IMPACT) (b). Bracket indicates two different tumor samples from the same patient. (c) Schematics of the non-synonymous SNVs observed in the PRC2 core components, EED and SUZ12, in 15 WES and 37 custom IMPACT MPNST samples. (d) Schematic of the overlap of mutations affecting NF1, PRC2 components (EED or SUZ12) and CDKN2A in all MPNSTs (NF1-associated, sporadic, radiotherapy-associated and epithelioid). Fleiss’ Kappa statistics, 3 way comparison of NF1, CDKN2A and PRC2 (EED or SUZ12) genetic alteration suggested that they significantly co-occur, Kappa= 0.21, p=0.001.
Figure 2
Figure 2. PRC2–loss MPNSTs exhibit distinct gene expression pattern from PRC2 wild-type MPNSTs, signifying activation of developmentally suppressed pathways
(a) Principal component analysis of the MPNST whole-transcriptome revealed that the PRC2 wild-type (wt) and PRC2-loss (SUZ12 loss and EED loss) samples segregate by principal component 1 (PC1). Each sample is color coded based on their corresponding PRC2 mutational status derived from WES except for S21 and S22 which are based on manual examination of the RNA-seq for mutations in the PRC2 components. Green: PRC2 wt; blue: SUZ12 loss; red: EED loss. (b) Heatmap of significantly differentially expressed genes between PRC2-loss and PRC2-wt MPNSTs identified by RNA-seq. Clustering was based on most differentially expressed 479 genes with FDR <0.05 and fold-change >8.0 (Supplementary Table 2). Samples are color coded based on PRC2 mutational status, green: PRC2 wt; blue: SUZ12 loss; red: EED loss. Scale bar, mean normalized fold change by log2. (c) Gene Ontology analysis of the differentially upregulated genes in PRC2-losscompared to PRC2-wt MPNSTs. (d) Gene expression by RNA-seq of a representative group of developmental master regulators and imprinted genes in PRC2-loss and PRC2-wt MPNSTs. Error bars +s.e.m. (e–g) GSEA plots of the ranked list of the differentially expressed genes between PRC2-loss and PRC2-wt MPNSTs using three gene sets: PRC2 module (e), the H3K27me3 targets in brain (g) and neural precursor cells (f).
Figure 3
Figure 3. H3K27me3 IHC significantly correlates with PRC2 genetic status and H3K27me3 loss characterizes progression from neurofibroma to MPNST
(a) Representative H&E and H3K37me3 IHC images of NF1-associated, sporadic and radiotherapy associated MPNSTs. Scale bars: 100 μm. (b) Correlation of PRC2 genetic status by WES, RNA-seq and custom targeted sequencing and H3K27me3 IHC status. (c) Representative H&E and H3K27me3 IHC images of neurofibroma, NF1-associated MPNST, and the interface of plexiform neurofibroma transition into MPNST. (d) Distribution of PRC2 loss (blue) and PRC2 presence (red) by H3K27me3 IHC in NF1-associated, sporadic, radiotherapy-associated, and epithelioid MPNSTs, and neurofibromas. Fisher’s exact test was used to calculate the p value.
Figure 4
Figure 4. PRC2 loss promotes cell proliferation and growth in PRC2-loss MPNST
(a) Immunoblots demonstrating SUZ12 loss and corresponding loss of H3K27me3 in ST88-14, a NF1-associated human MPNST cell line compared to a sporadic human MPNST cell line, MPNST724, with intact PRC2 and retained H3K27me3 expression. Introduction of exogenous Flag-HA-tagged SUZ12 (FH-SUZ12), but not Flag-HA-tagged EED (FH-EED) in ST88-14 restores the H3K27me3 protein levels. *: exogenous Flag-HA-tagged SUZ12 or EED; **: endogenous SUZ12 or EED. (b) Immunofluorescence (IF) of H3k27me3 demonstrating the restoration of H3K27me3 at the cellular level by introducing FH-SUZ12 in ST88-14 MPNST cell line with SUZ12 loss. Scale bars: 100 μm. (c) Representative growth curves of MPNST724 and ST88-14 demonstrating that introduction of FH-SUZ12, but not FH-EED, in the SUZ12-deficient ST88-14 cells leads to significant growth retardation, whereas it had no effect in MPNST724 cells. Similar results have been obtained in at least 3 independent experiments. (d) ST88-14 and MPNST724 cells were infected with vector control (blue) and FH-SUZ12 (green). Plots of the qRT-PCR expression (expressed as 2−ΔΔCt) and ChIP-qPCR promoter localization (expressed as % input) of SUZ12, EZH2, H3K27me3, H3K4me3, H3K27ac, and IgG control of FOXN4, IGF2, PAX2, and TLX1 genes are shown. Error bars +s.e.m. n=3.

References

    1. Brennan MF, Antonescu CR, Maki RG. Management of Soft Tissue Sarcoma. Springer; New York: 2013. p. 553.
    1. LaFemina J, et al. Oncologic outcomes of sporadic, neurofibromatosis-associated, and radiation-induced malignant peripheral nerve sheath tumors. Ann Surg Oncol. 2013;20:66–72. - PMC - PubMed
    1. Stucky CC, et al. Malignant peripheral nerve sheath tumors (MPNST): the Mayo Clinic experience. Ann Surg Oncol. 2012;19:878–85. - PubMed
    1. Eilber FC, et al. Validation of the postoperative nomogram for 12-year sarcoma-specific mortality. Cancer. 2004;101:2270–5. - PubMed
    1. Rodriguez FJ. Peripheral nerve sheath tumors: the elegant chapter in surgical neuropathology. Acta Neuropathol. 2012;123:293–4. - PubMed

Publication types

MeSH terms

Associated data