. 2015 Jul;34(28):3688-99.
doi: 10.1038/onc.2014.299. Epub 2014 Sep 22.

Casein kinase 2α regulates glioblastoma brain tumor-initiating cell growth through the β-catenin pathway

Affiliations

Casein kinase 2α regulates glioblastoma brain tumor-initiating cell growth through the β-catenin pathway

R T Nitta et al. Oncogene. 2015 Jul.

Abstract

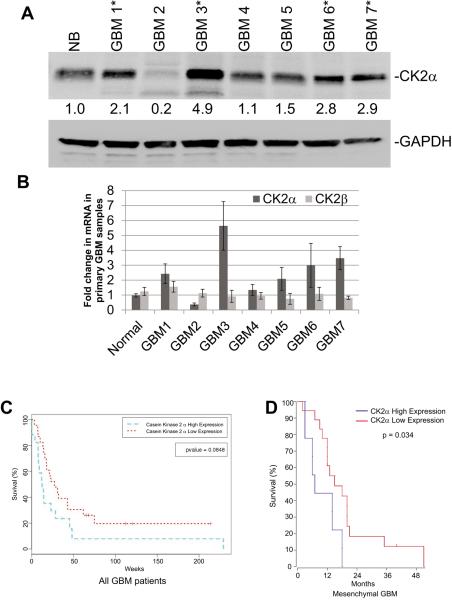
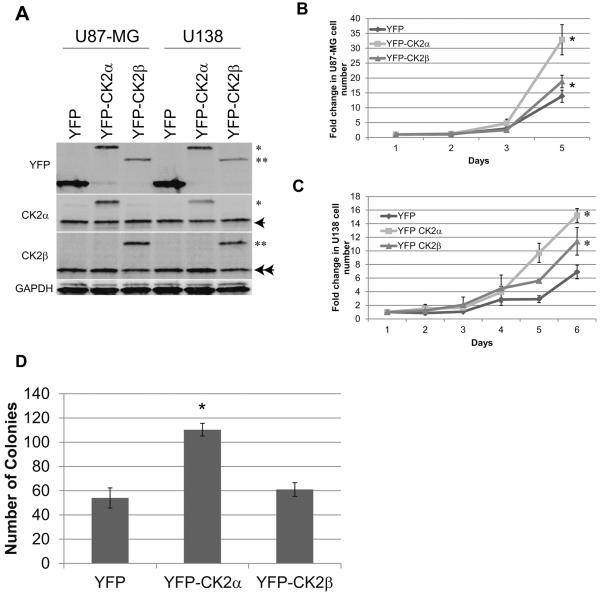
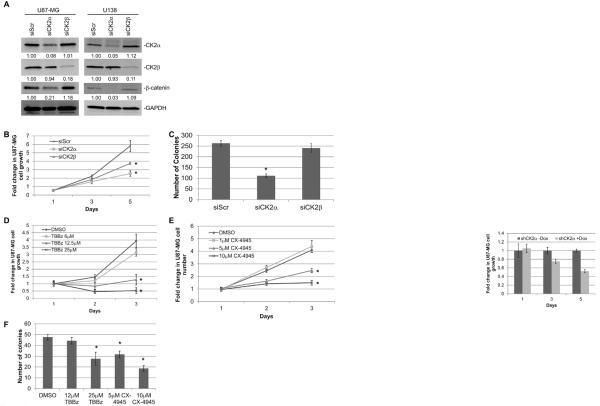
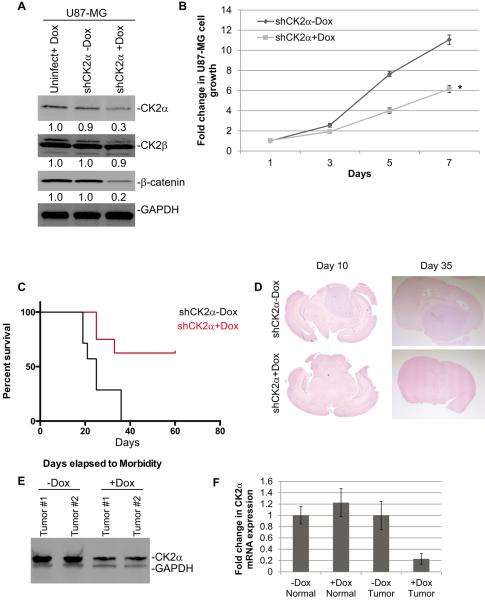
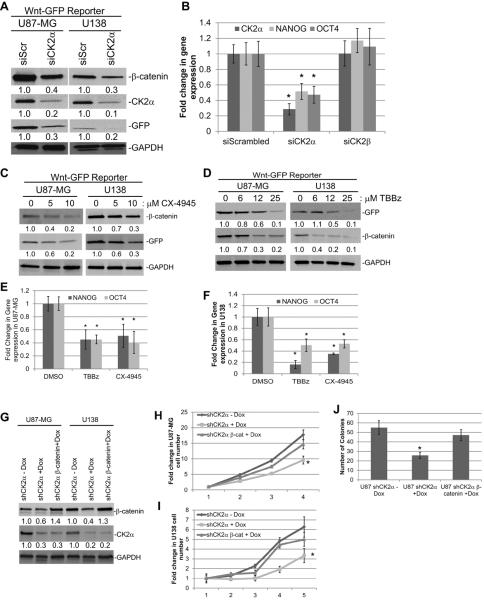
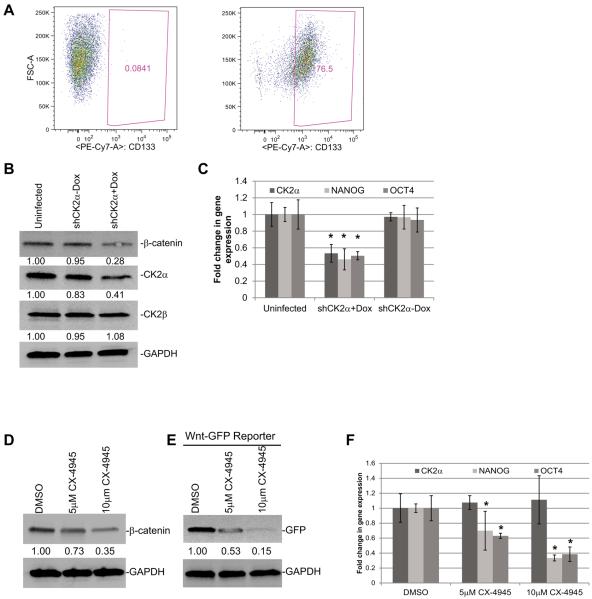
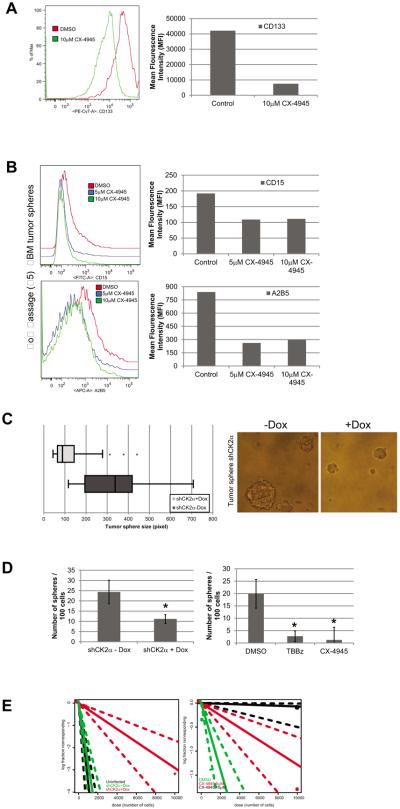
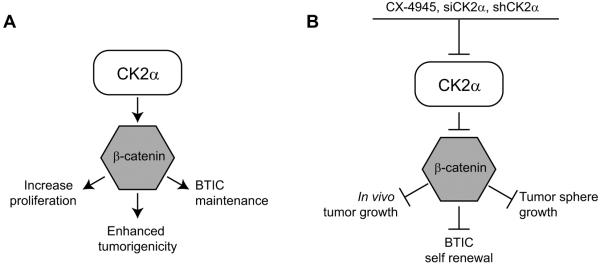
Glioblastoma (GBM) is the most common and fatal primary brain tumor in humans, and it is essential that new and better therapies are developed to treat this disease. Previous research suggests that casein kinase 2 (CK2) may be a promising therapeutic target for GBMs. CK2 has enhanced expression or activity in numerous cancers, including GBM, and it has been demonstrated that inhibitors of CK2 regressed tumor growth in GBM xenograft mouse models. Our studies demonstrate that the CK2 subunit, CK2α, is overexpressed in and has an important role in regulating brain tumor-initiating cells (BTIC) in GBM. Initial studies showed that two GBM cell lines (U87-MG and U138) transduced with CK2α had enhanced proliferation and anchorage-independent growth. Inhibition of CKα using siRNA or small-molecule inhibitors (TBBz, CX-4945) reduced cell growth, decreased tumor size, and increased survival rates in GBM xenograft mouse models. We also verified that inhibition of CK2α decreased the activity of a well-known GBM-initiating cell regulator, β-catenin. Loss of CK2α decreased two β-catenin-regulated genes that are involved in GBM-initiating cell growth, OCT4 and NANOG. To determine the importance of CK2α in GBM stem cell maintenance, we reduced CK2α activity in primary GBM samples and tumor spheres derived from GBM patients. We discovered that loss of CK2α activity reduced the sphere-forming capacity of BTIC and decreased numerous GBM stem cell markers, including CD133, CD90, CD49f and A2B5. Our study suggests that CK2α is involved in GBM tumorigenesis by maintaining BTIC through the regulation of β-catenin.


Figures

Figure 1
Figure 1
Increased CK2α expression may lead to a worse prognosis for GBM patients. A, Western blot measuring the fold change in CK2α in seven primary GBM samples compared with normal brain (NB). GAPDH was used to control for protein load. B, QPCR analysis of primary GBM samples. *-represents samples with higher expression of CK2α. C. Survival curve for all GBM patients with high or low expression of CK2α using the REMBRANDT database. D. Survival curve for the mesenchymal subtype of GBM patients with high or low expression of CK2α using the TCGA.
Figure 2
Figure 2
Exogenous overexpression of CK2 genes increased tumorigenesis in two immortalized GBM cell lines. A, U87-MG and U138 cells were stably transduced with YFP, YFPCK2α, or YFP-CK2β. * represents YFP-CK2α, ** represents YFP-CK2β, arrow represents endogenous CK2α, double arrow represents endogenous CK2β. B and C, cell growth of GBM cell lines transduced with YFP-CK2α or YFP-CK2β. The cell lines were cultured in 10% fetal bovine serum and viable cells were counted daily. Results are from two separate experiments, each done in triplicate. *represents a statistically significant change from the control, P < 0.05, as measured by the Mann-Whitney U test. D, soft agar analysis of U87-MG cells expressing CK2α or CK2β. Results are from two separate experiments, each done in triplicate. *represents a statistically significant change from the control, P < 0.05.
Figure 3
Figure 3
Reducing expression or inhibiting CK2α activity decreased GBM tumorigenesis in vitro. A, siRNAs specific to CK2α (siCK2α) and CK2β (siCK2β) were introduced into U87-MG and U138 cells. A scrambled nonspecific siRNA (siScr) was used as a control. The numbers under each blot correspond to the fold change in protein levels relative to the control. B, cell growth analysis of U87-MG transfected with siRNA. The cell lines were cultured in 10% fetal bovine serum and viable cells were counted daily. Results are from two separate experiments, each done in triplicate. C, anchorage-independent growth of U87-MG cells treated with siRNAs. D and E, cell growth analysis of U87-MG treated with CK2 inhibitors TBBz or CX-4945. F, anchorage-independent growth of U87-MG cells treated CK2 inhibitors in soft agar. Results are from two separate experiments, each done in triplicate. *represents a statistically significant change from the control, P < 0.05, as measured by the Mann–Whitney U test
Figure 4
Figure 4
Reducing expression of CK2α using shRNA decreased GBM tumorigenesis in vivo. A, shRNAs specific to CK2α (shCK2α) were introduced through lentiviral infections into U87-MG cells. 5 μg/mL of Dox was used to induce expression of shRNA (shCK2α+Dox). The uninduced infected cells (shCK2α-Dox) and uninfected cells treated with Dox (uninfect+Dox) were used as controls. The numbers under each blot correspond to the fold change in protein levels relative to the uninfected control. B, cell growth analysis of U87-MG infected with shCK2α. *represents a statistically significant change from the control, P < 0.05, as measured by the Mann-Whitney U test. C, survival curve of mice intracranially injected with infected cells. D, representative hematoxylin and eosin staining of brains 10 days (left) and 35 days (right) post-injection. E, Western blot showing CK2α expression from two representative tumors harvested 10 days post-injection. F, QPCR analysis comparing normal mouse brain to xenograft tumors from mice 40 days post-injection.
Figure 5
Figure 5
U87-MG and U138 cells were transduced with a Wnt/β-catenin GFP reporter construct. A, reducing CK2α expression using siCK2α decreased β-catenin expression and transcriptional activity (as measured by GFP). B, QPCR analysis of β-catenin-regulated genes, OCT4 and NANOG, in U87-MG cells transfected with siCK2α or siCK2β. C and D, treatment with the CK2 inhibitors, CX-4945 or TBBz, decreased β-catenin expression and transcriptional activity in both U87-MG and U138 cells. E and F, QPCR analysis of OCT4 and NANOG after treatment with CK2 inhibitors. G, β-catenin was stably transduced into U87 shCK2α or U138 shCK2α cell lines. Cells treated were either treated with 5 μg/mL of Dox (+Dox) or a PBS control (−Dox). H, Cell growth of U87 shCK2α cells transduced with β-catenin and treated with Dox. I, Cell growth of U138 shCK2α cells transduced with β-catenin and treated with Dox. F, anchorage-independent growth of U87 shCK2α cells transduced with β-catenin and treated with Dox in soft agar. Results are from two separate experiments, each done in triplicate. *represents a statistically significant change from the control, P < 0.05, as measured by the Mann-Whitney U test
Figure 6
Figure 6
Reducing CK2α expression decreases β-catenin expression and activity in tumor spheres derived from GBM patients. A, FACS analysis showing the expression of CD133 in the tumor sphere cell line (right) compared with the isotype control (left). B, shRNAs specific to CK2α (shCK2α) were introduced through lentiviral infections into a tumor sphere cell line. 5 μg/mL of Dox was used to induce expression of shRNA (shCK2α+Dox). The uninduced infected cells (shCK2α-Dox) and uninfected cells treated with Dox (Uninfected) were used as controls. The numbers under each blot correspond to the fold change in protein levels relative to the control. C, QPCR analysis of β-catenin-responsive genes. D, Western blot showing protein expression after tumor spheres were treated with CX-4945. E, Tumor spheres transduced with Wnt/β-catenin GFP reporter and treated with CX-4945. F, QPCR analysis of β-catenin-responsive genes after treatment with CK2 inhibitor. *represents a statistically significant change from the control, P < 0.05, as measured by the Mann–Whitney U test
Figure 7
Figure 7
CK2α activity is important for maintaining the stem cell phenotypes in GBM tumor spheres. A, FACS analysis of tumor spheres treated with 5μM and 10μM of CX-4945. Left, histogram of FACS profile. Right, Mean Fluorescence Intensity (MFI) of each treatment. B, FACS analysis of CD15+ and CD90+ cells. Left, histogram of FACS profile. Right, Mean Fluorescence Intensity (MFI) of each treatment. C, tumor sphere size after infection with inducible shCK2α. Left, Cells induced with Dox (shCK2α+Dox) and uninduced tumor spheres (shCK2α-Dox). Right, representative image of tumor spheres after CK2α expression was modulated. D, tumor sphere formation capacity was monitored by plating 100 cells and counting the number of spheres that formed after 14 days. Left, shCK2α+Dox and shCK2α-Dox induced cells. Right, tumor spheres cultured in 5μM CX-4945 and 25μM of TBBz. *represents a statistically significant change from the control, P < 0.05, as measured by the Mann–Whitney U test. E, Left, LDA of GBM tumor spheres with modulated CK2α expression using shCK2α. Black represents uninfected cells +Dox, green represents spheres not induced (shCK2α-Dox), and red represents spheres induced with Dox (shCK2α+Dox). Dotted lines represent the 95% confidence interval. Right, LDA of tumor spheres treated with varying concentrations of CX-4945. Green represents DMSO-treated spheres, red represents spheres treated with 5 μM CX-4945, black represents spheres treated with 10μM CX-4945.
Figure 8
Figure 8
Diagram of the CK2α and β-catenin pathway in GBM. A, Signaling cascade in which CK2α regulates GBM tumorigenesis through β-catenin. B, Effects of CK2α inhibition on GBM growth.

References

    1. Louis D, Ohgaki H, Wiestler O, Cavanee W. Glioblastoma. WHO Classification of Tumours of the Central Nervous System. 2007:33–49. Ref Type: Generic. - PMC - PubMed
    1. Stupp R, Mason WP, van den Bent MJ, Weller M, Fisher B, Taphoorn MJ, et al. Radiotherapy plus concomitant and adjuvant temozolomide for glioblastoma. 2005 Mar 10;352(10):987–96. - PubMed
    1. Singh SK, Hawkins C, Clarke ID, Squire JA, Bayani J, Hide T, et al. Identification of human brain tumour initiating cells. Nature. 2004 Nov 18;432(7015):396–401. - PubMed
    1. Bao S, Wu Q, McLendon RE, Hao Y, Shi Q, Hjelmeland AB, et al. Glioma stem cells promote radioresistance by preferential activation of the DNA damage response. Nature. 2006 Dec 7;444(7120):756–60. - PubMed
    1. Litchfield DW. Protein kinase CK2: structure, regulation and role in cellular decisions of life and death. Biochem J. 2003 Jan 1;369(Pt 1):1–15. - PMC - PubMed

Publication types

MeSH terms