. 2014 Sep 29;30(6):688-700.
doi: 10.1016/j.devcel.2014.07.021. Epub 2014 Sep 18.

Trim58 degrades Dynein and regulates terminal erythropoiesis

Affiliations

Trim58 degrades Dynein and regulates terminal erythropoiesis

Christopher S Thom et al. Dev Cell. .

Abstract

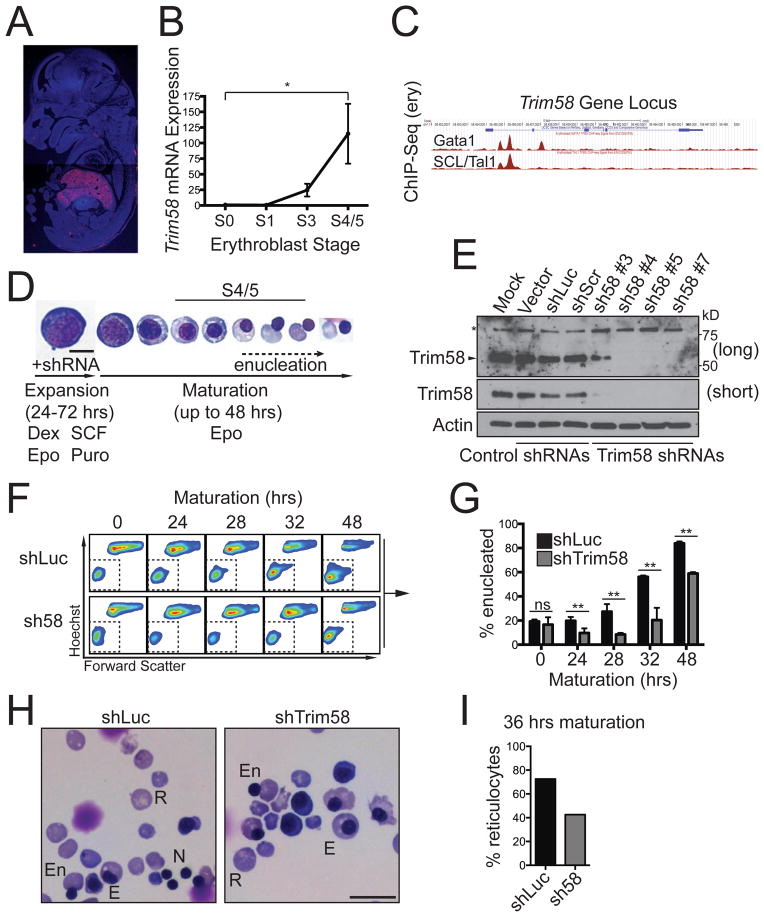
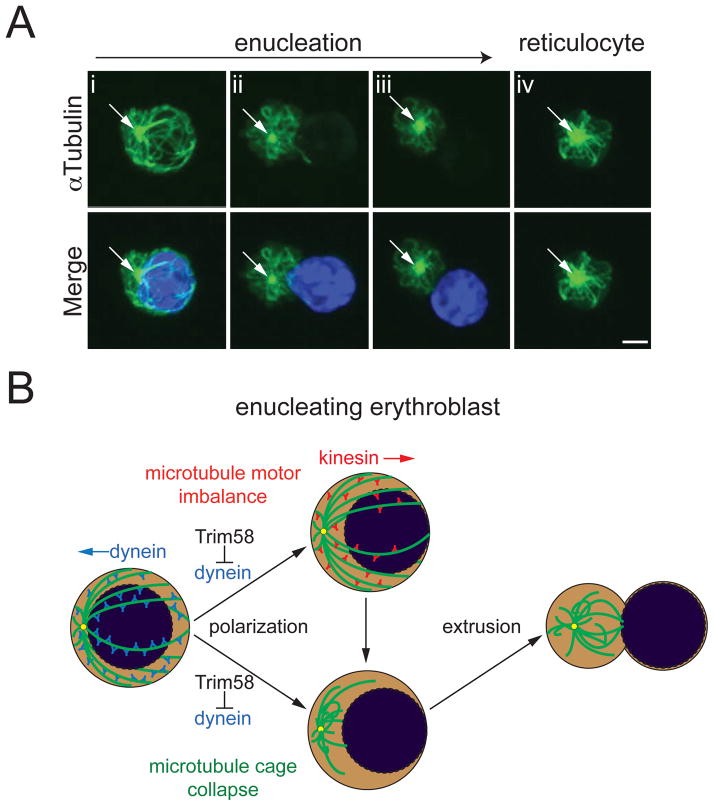
TRIM58 is an E3 ubiquitin ligase superfamily member implicated by genome-wide association studies to regulate human erythrocyte traits. Here, we show that Trim58 expression is induced during late erythropoiesis and that its depletion by small hairpin RNAs (shRNAs) inhibits the maturation of late-stage nucleated erythroblasts to anucleate reticulocytes. Imaging flow cytometry studies demonstrate that Trim58 regulates polarization and/or extrusion of erythroblast nuclei. In vitro, Trim58 directly binds and ubiquitinates the intermediate chain of the microtubule motor dynein. In cells, Trim58 stimulates proteasome-dependent degradation of the dynein holoprotein complex. During erythropoiesis, Trim58 expression, dynein loss, and enucleation occur concomitantly, and all are inhibited by Trim58 shRNAs. Dynein regulates nuclear positioning and microtubule organization, both of which undergo dramatic changes during erythroblast enucleation. Thus, we propose that Trim58 promotes this process by eliminating dynein. Our findings identify an erythroid-specific regulator of enucleation and elucidate a previously unrecognized mechanism for controlling dynein activity.


Conflict of interest statement

The authors declare no competing financial interests.

Figures

Figure 1
Figure 1. Trim58 is expressed during late stage erythropoiesis and regulates erythroid maturation
(A) RNA in situ hybridization for Trim58 mRNA in an embryonic (E) day 14.5 mouse embryo showing strong expression (red) in fetal liver (FL), the site of definitive erythropoiesis. (B) E14.5 FL erythroblasts were flow cytometry-purified (Pop et al., 2010) and Trim58 mRNA was analyzed by semiquantitative real-time PCR. The y-axis shows relative mRNA expression, normalized to S0 cells, which were assigned a value of 1. The x-axis shows progressive developmental stages from less to more mature. The results represent mean ± SEM for 3 biological replicates. *p<0.05. (C) Chromatin immunoprecipitation-sequence (ChIP-Seq) analysis of transcription factor binding to the Trim58 locus in E14.5 FL erythroblasts (data from (Pimkin et al., 2014)). The blue line depicts the Trim58 gene, with exons shown as rectangles. Transcription factor binding sites are indicated in red. (D) Trim58 knockdown studies. E14.5 murine FL erythroid precursors were purified, infected with retroviruses encoding Trim58 or control shRNAs, and cultured for 24–72 hours in expansion medium with puromycin (Puro) to inhibit terminal maturation and select for infected cells. The cells were then switched to maturation medium, which facilitates development to the reticulocyte stage over ~48 hours. Late stage S4/5 cells are small and hemoglobinized with condensed nuclei (see panel B) (Pop et al., 2010). Epo, erythropoietin; SCF, stem cell factor; Dex, dexamethasone. Scale bar, 10 μm. (E) Western blot for Trim58 in erythroblasts expressing Trim58 or control shRNAs after 48 hours maturation. Luc, luciferase; Scr, scrambled. The asterisk (*) represents a nonspecific band. “Long” and “short” exposures are from the same blot. (F) Enucleation of control (shLuc) and Trim58-deficient (shTrim58 #4) erythroblasts measured by flow cytometry the indicated time points. During maturation, erythroblasts become smaller, indicated by decreased forward scatter, and ultimately enucleate to become Hoechst-negative reticulocytes (boxed regions). (G) Percent (%) enucleation over time in cultures treated with control (shLuc) or Trim58 shRNA #4. Mean ± SD for 3 biological replicates. (H) Representative histology of control (shLuc) and Trim58-deficient (shTrim58 #4) erythroid cultures after 36 hours maturation. Examples of anucleate reticulocytes (R), nucleated erythroblasts (E), extruded nuclei (N) and erythroblasts in the process of enucleation (En) are shown. Scale bar, 20 μm. (I) Summary of reticulocyte fractions from panel H. Six hundred cells were counted on each slide. See also Figures S1 and S2.
Figure 2
Figure 2. Trim58 binds directly to the molecular motor dynein
(A) Modular structure of Trim58 showing the RING, BBox, Coiled Coil (CC) and immunoglobulin-like PRY-SPRY (PS) domains with relevant amino acids numbered. In some Trim proteins, the RING domain recruits E2 conjugases carrying activated Ubiquitin and the PS domain binds substrates. (B) FLAG-tagged Trim58 PS domain or vector (V) were stably expressed in the G1E proerythroblast line. Lysates were immunoprecipitated (IP) with FLAG antibody, fractionated by SDS-polyacrylamide gel electrophoresis and stained with Coomassie Blue Silver. Numbers denote visible bands from PS immunoprecipitates that were excised for mass spectrometric (MS) analysis. The same regions from the control (V) lane were analyzed similarly. MS identified exclusively in the PS lane peptides from dynein heavy chain (DHC), dynein intermediate chain (DIC), dynein light intermediate chains 1/2 (DLIC) and Trim58 PS, as indicated for each band. See also Tables 1 and S1. Inp, input (1%). (C) Lysates from G1E cells expressing FLAG-PS or V were immunoprecipitated with FLAG antibody and analyzed by Western immunoblotting (IB) for DHC, DIC, FLAG and Codanin1 (Cdan1, negative control). Inp, input (5%). (D) E14.5 murine FL erythroblasts were lysed, immunoprecipitated with anti-DIC antibody or IgG control and analyzed by Western blotting for the indicated proteins. α globin represents a negative control. Inp, input (0.5%). (E) Recombinant purified GST-Trim58 PS domain (GST-PS) or GST were incubated with purified bovine holodynein complex and glutathione-Sepharose beads. Bound proteins were analyzed by Western blotting. Equal percentages of total input (Inp), pull down (PD) and supernatant (SN) samples were loaded. (F) 293T cells were transfected with expression plasmids encoding hemagglutinin (HA) fused to the indicated DIC amino acids. After 24 hours, cells were lysed and incubated with GST-PS or GST and glutathione-Sepharose beads. Bound proteins were analyzed by anti-HA Western blotting. PD, pull down; SN, supernatant (1%). (G) Size-exclusion chromatography coupled to multiangle laser light scattering (SEC-MALLS) data for PS, GST-DIC (1–120) and a 1:1 mixture. Protein concentration was measured on an inline refractive index detector. Light scattering data converted to molecular weight are shown above each chromatography trace and relate to the right-hand y-axis. The observed molecular weights are consistent with a 1:1 interaction between the two proteins augmented by the dimerization of the GST tag appended to DIC (1–120). (H) DIC domain structure showing the amino-terminal coiled coil (CC) motif, which binds Trim58. aa#, amino acid number of DIC. See also Figure S3.
Figure 3
Figure 3. Trim58 ubiquitinates dynein and promotes its proteasomal degradation
(A) Vector (V) and full-length Trim58 constructs with amino-FLAG and carboxyl-mCherry tags. The RΔ mutant contains two missense mutations that abrogate E3 ubiquitin ligase activity. (B) Trim58-expressing HeLa cells were infected with retrovirus encoding FLAG-Trim58 (WT or RΔ) or vector (V), selected in puromycin for 3 days, then analyzed by Western blotting before or after treatment with the proteasome inhibitor MG132 (10 μM) for 4 hours at 37 °C. See also Figure S4. (C) In vitro ubiquitination assay. Recombinant GST-tagged proteins were incubated with E1, E2 (UBE2D3) and HA-tagged Ubiquitin (Ub) for 1 hour at 37 °C, followed by Western blotting for HA or GST. Trim63 was used as a positive control. The high molecular weight smears indicate poly-HA-Ub attachment to the GST fusion proteins. (D) In vitro ubiquitination assay. GST-DIC (1–120) was incubated with WT or RΔ Trim58, E1 and E2 enzymes, and HA-Ub for 1 hour at 37 °C, followed by Western blotting using an anti-DIC antibody. Two arrowheads indicate DIC protein, where the higher one denotes GST-DIC (1–120), and the lower is DIC (1–120). The asterisk (*) represents a nonspecific band. (E) Golgi distribution in HeLa cells expressing Trim58. Cells were transfected with expression plasmids encoding Trim58-mCherry or CC1-mCherry, a dynein inhibitor (Quintyne et al., 1999). After 36 hours, the cells were fixed, stained for the Golgi matrix protein GM130 and DNA (DAPI), and visualized by confocal microscopy. The percentages of mCherry-positive cells that displayed normal punctate perinuclear Golgi body distribution are shown at right as mean ± SD for 3 independent experiments, with >100 cells counted per experiment. **p<0.01 vs. vector control; ns, not significant. (F) Mitotic progression in HeLa cells expressing Trim58-mCherry proteins, as analyzed by time-lapse microscopy. Representative images show mitotic progression in outlined cells. Expression of WT Trim58 delayed progression from cell rounding (~metaphase) to anaphase onset, compared to cells expressing vector or RΔ Trim58. BF, brightfield; mCh, mCherry. Scale bar (upper left panel), 16 μm. (G) Quantitative analysis of mitosis in Trim58-expressing HeLa cells. The graph on the left shows time elapsed between cell rounding and anaphase with mean ± SD for all observed mitotic cells. The percentages of cells with delayed (>200 min) or failed mitosis manifested as cell death between rounding and anaphase are shown on the right. (V, n=134 normal mitoses; WT, n=50 normal, 13 delayed, 11 failed mitoses; RΔ, n=100 normal, 7 delayed mitoses). **p<0.01; ns, not significant. See also Movies S1A–D.
Figure 4
Figure 4. Trim58 expression correlates with loss of dynein and enucleation during erythroid maturation
Fetal liver erythroblasts were infected with retrovirus encoding shRNA against (A) luciferase (shLuc) or (B) Trim58 (shRNA #4), cultured in expansion medium for 72 hours, then shifted to maturation medium at time 0 (see also Figure 1D). Whole cell lysates were prepared at the indicated time points and endogenous proteins were analyzed by Western blotting. The lane marked “+” in panel B indicates endogenous Trim58 expression in shLuc-expressing cells at 44 hours. (C) Kinetics of enucleation in cells from panels A and B, determined as shown in Figure 1F. The results represent mean ± SD for 4 biological replicates. *p<0.05; **p<0.01; ns, not significant. See also Figure S5.
Figure 5
Figure 5. Trim58 regulates nuclear polarization and extrusion during erythropoiesis
(A) Morphology parameters to assess specific steps of erythroid maturation by imaging flow cytometry. Declining nuclear diameter reflects condensation (broken line). The Δ centroid (distance between centers of the nucleus (red) and cytoplasm (green)) increases during nuclear polarization and extrusion. The aspect ratio (minor axis (blue line) divided by major axis (red line)) falls as cells become oblong during nuclear extrusion. (B) Representative analysis of fetal liver erythroblasts at 36 hours maturation. Spherical nucleated erythroblasts are pink. Oblong cells extruding their nuclei (decreased aspect ratio and increased Δ centroid) are orange. Cells in late mitosis, visualized to the left of the orange gate, exhibit low aspect ratio and low Δ centroid. (C) Representative images of cells from panel B that are, 1) spherical with a non-condensed centralized nucleus; 2) spherical with a condensed centralized nucleus; 3) spherical with a condensed polarized nucleus; or 4) oblong with a condensed extruding nucleus. (D–F) Erythroblasts expressing GFP and control (shLuc) or Trim58 shRNA #4 were analyzed by imaging flow cytometry at the indicated times during maturation. The results represent mean ± SD for 4 biological replicates, ~3000 cells analyzed per replicate. (D) Average nuclear diameter over time showing progressive condensation. (E) Percent (%) spherical cells over time, including those with central or polarized nuclei. (F) Percent (%) oblong cells with extruding nuclei over time. (G) Δ centroid distribution within spherical erythroblasts depicted in panel B. Higher Δ centroid values indicate polarized nuclei. Representative histograms are shown for three time points. Dashed white bars indicate the mean Δ centroid value for each plot. (H) Quantification of mean Δ centroid values in control (shLuc) or Trim58-deficient (shTrim58 #4) erythroblast cultures shown as mean ± SD for 3 biological replicates, ~3000 cells analyzed per replicate. *p<0.05, **p<0.01. See also Figure S6.
Figure 6
Figure 6. Nuclear movement during erythroblast enucleation
(A) Primary murine fetal liver erythroblasts were fixed, stained for microtubules (αTubulin, green) and DNA (DAPI, blue), and analyzed by deconvolution fluorescent microscopy. Arrow indicates a single microtubule organizing center (MTOC). Scale bar, 2 μm. (B) Model for the actions of Trim58 during erythroblast enucleation. At early stages of maturation, the nucleus resides within a cage of microtubules (green), and is maintained in close proximity to the MTOC (yellow dot) by dynein. Trim58 causes dynein degradation, which promotes nuclear polarization through two potential mechanisms. First, microtubule motor imbalance may allow unopposed kinesin molecular motors to polarize the nucleus (top). Second, loss of dynein promotes detachment of microtubules from the nucleus and/or cell cortex (“cage collapse”), thereby enhancing polarization, extrusion and enucleation.

References

    1. Chen CY, Pajak L, Tamburlin J, Bofinger D, Koury ST. The effect of proteasome inhibitors on mammalian erythroid terminal differentiation. Exp Hematol. 2002;30:634–639. - PubMed
    1. Chen K, Liu J, Heck S, Chasis JA, An X, Mohandas N. Resolving the distinct stages in erythroid differentiation based on dynamic changes in membrane protein expression during erythropoiesis. Proc Natl Acad Sci U S A. 2009;106:17413–17418. - PMC - PubMed
    1. Cheng Y, Wu W, Kumar SA, Yu D, Deng W, Tripic T, King DC, Chen KB, Zhang Y, Drautz D, et al. Erythroid GATA1 function revealed by genome-wide analysis of transcription factor occupancy, histone modifications, and mRNA expression. Genome Res. 2009;19:2172–2184. - PMC - PubMed
    1. Dolznig H, Bartunek P, Nasmyth K, Mullner EW, Beug H. Terminal differentiation of normal chicken erythroid progenitors: shortening of G1 correlates with loss of D-cyclin/cdk4 expression and altered cell size control. Cell Growth Differ. 1995;6:1341–1352. - PubMed
    1. Fabrini R, De Luca A, Stella L, Mei G, Orioni B, Ciccone S, Federici G, Lo Bello M, Ricci G. Monomer-dimer equilibrium in glutathione transferases: a critical re-examination. Biochemistry. 2009;48:10473–10482. - PubMed

Publication types