. 2014 Dec;1841(12):1754-66.
doi: 10.1016/j.bbalip.2014.09.009.

Hepatic fatty acid uptake is regulated by the sphingolipid acyl chain length

Hepatic fatty acid uptake is regulated by the sphingolipid acyl chain length

Woo-Jae Park et al. Biochim Biophys Acta. 2014 Dec.

Erratum in

  • Biochim Biophys Acta. 2015 Jul;1851(7):996

Abstract

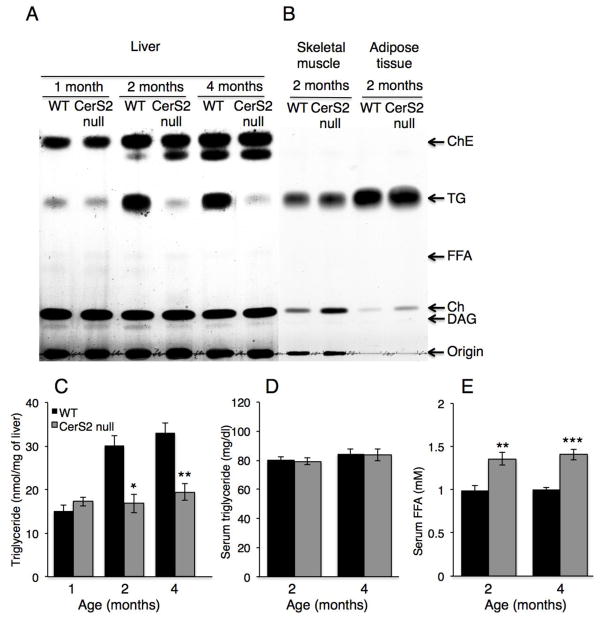
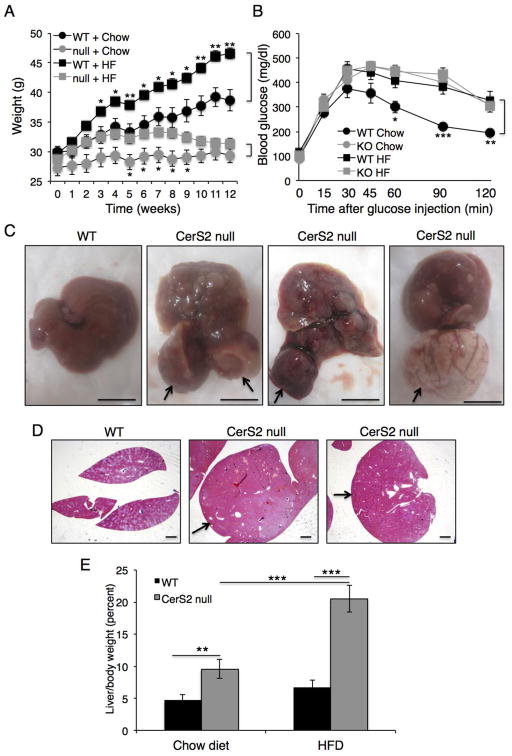
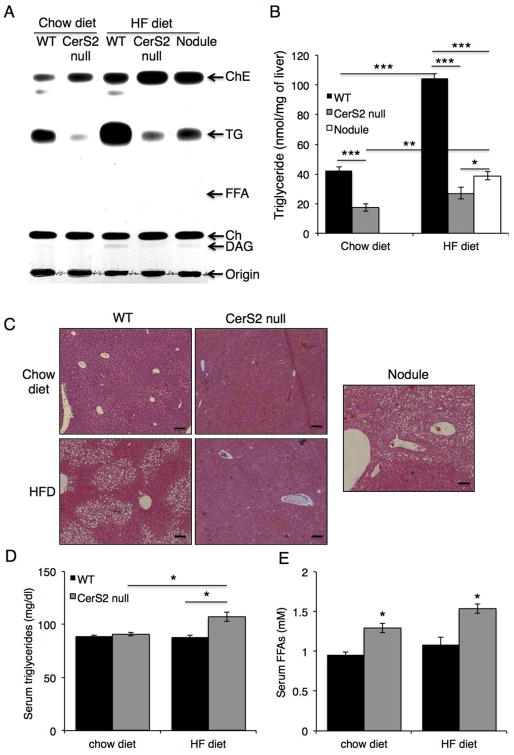
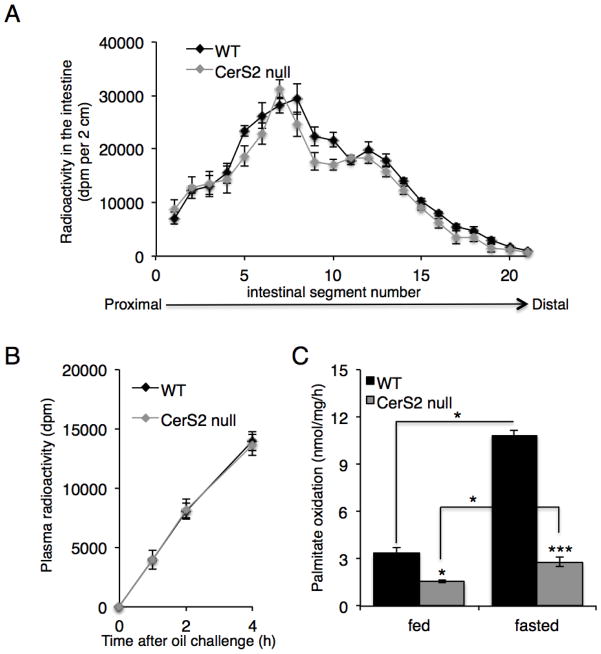
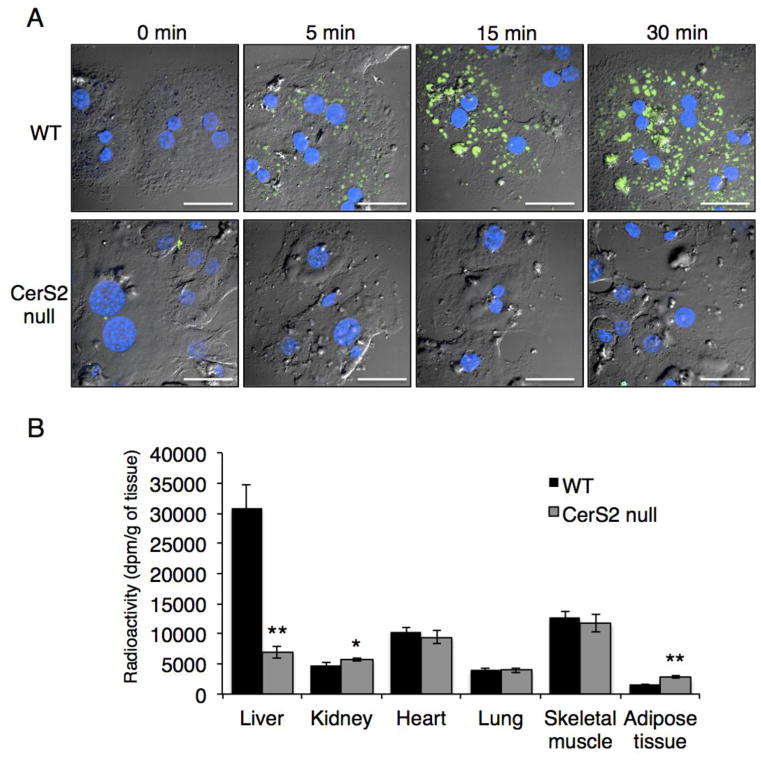
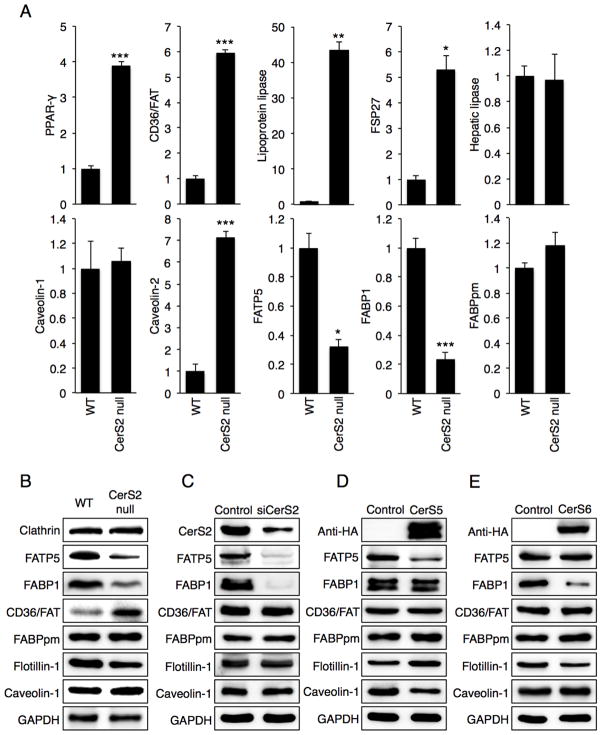
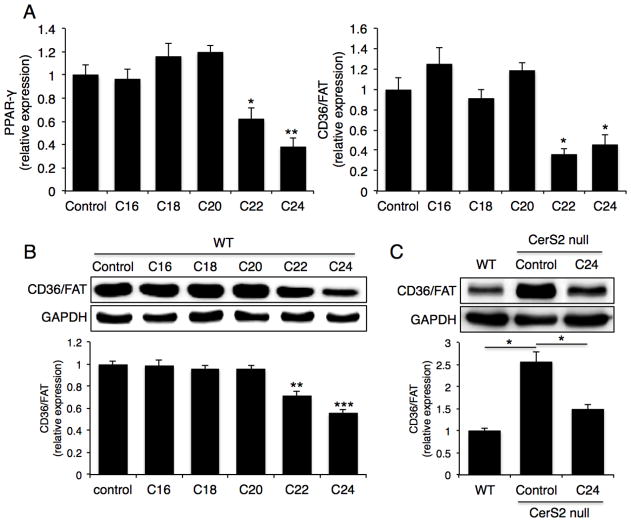
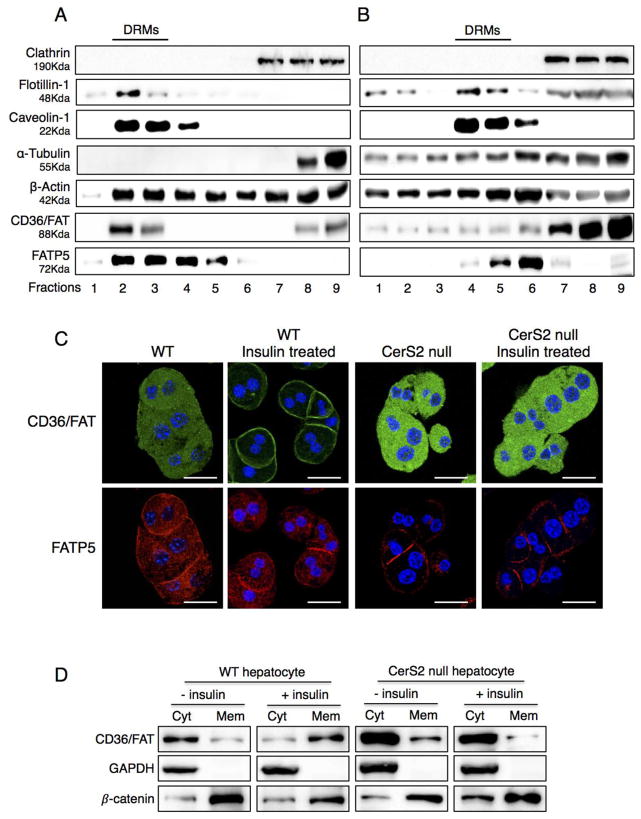
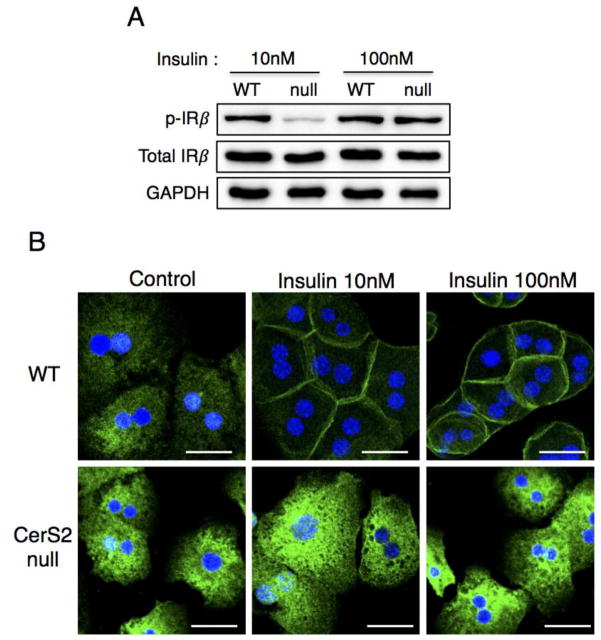
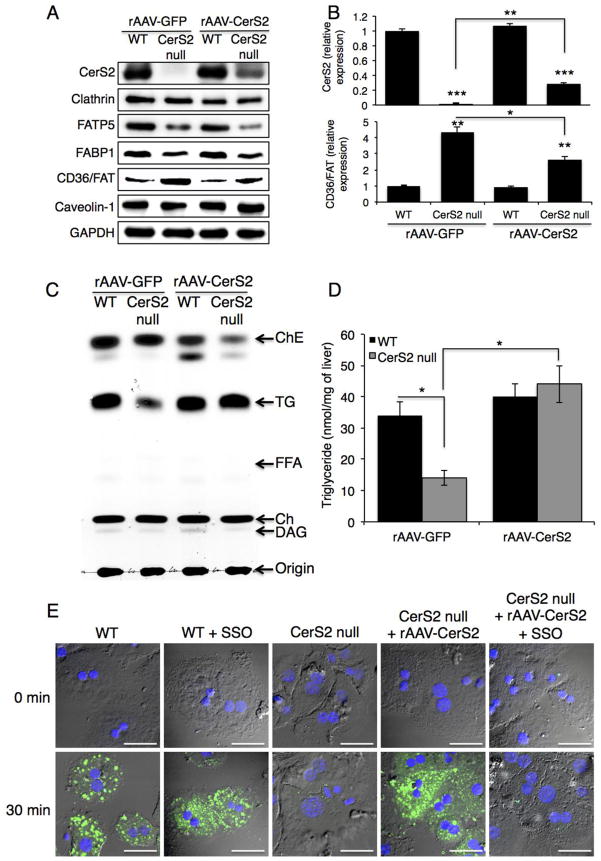
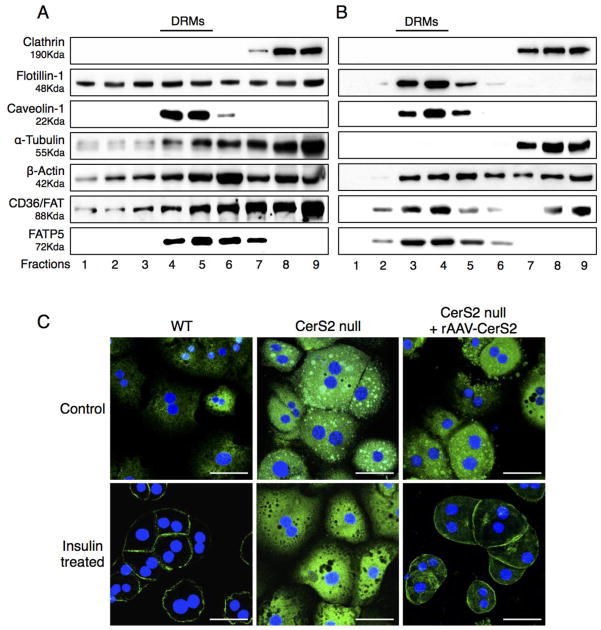
Ceramide synthase 2 (CerS2) null mice cannot synthesize very-long acyl chain (C22-C24) ceramides resulting in significant alterations in the acyl chain composition of sphingolipids. We now demonstrate that hepatic triacylglycerol (TG) levels are reduced in the liver but not in the adipose tissue or skeletal muscle of the CerS2 null mouse, both before and after feeding with a high fat diet (HFD), where no weight gain was observed and large hepatic nodules appeared. Uptake of both BODIPY-palmitate and [VH]-palmitate was also abrogated in the hepa- tocytes and liver. The role of a number of key proteins involved in fatty acid uptake was examined, including FATP5, CD36/FAT, FABPpm and cytoplasmic FABP1. Levels of FATP5 and FABP1 were decreased in the CerS2 null mouse liver, whereas CD36/FAT levels were significantly elevated and CD36/FAT was also mislocalized upon insulin treatment. Moreover, treatment of hepatocytes with C22-C24-ceramides down-regulated CD36/FAT levels. Infection of CerS2 null mice with recombinant adeno-associated virus (rAAV)-CerS2 restored normal TG levels and corrected the mislocalization of CD36/FAT, but had no effect on the intracellular localization or levels of FATP5 or FABP1. Together, these results demonstrate that hepatic fatty acid uptake via CD36/FAT can be regulated by altering the acyl chain composition of sphingolipids.


Figures

Fig. 1
Fig. 1. TG and FFA levels in 1–4 month-old CerS2 null mouse liver
TG levels were measured in liver by two independent methods, (A) TLC (representative result of 3 independent experiments) and (C) a colorimetric assay (n=3). (B) Lipid levels in skeletal muscle and adipose tissue. (D) TG and (E) FFA levels in serum (n=5–6). ChE, cholesterol ester; Ch, cholesterol; DAG, diacylglycerol. Data are means ± S.E.M. *P < 0.05, **P < 0.01, ***P < 0.001.
Fig. 2
Fig. 2. Effect of a HFD on CerS2 null mice
(A) Weight of 6-month-old WT and CerS2 null mice during feeding with either a chow or HFD (n=8). (B) Glucose tolerance test after 8 h starvation (n=8). (C) Size of hepatic nodules 12 weeks after feeding with a HFD. Arrows indicate hepatic nodules in three examples of CerS2 null mouse liver. Scale bar, 10 mm. (D) Hematoxylin & eosin staining of WT and CerS2 null mouse liver after feeding with a HFD. Arrows indicate hepatic nodules. Scale bar, 1 mm. (E) Liver/body mass (n=4). Data are means ± S.E.M.** P< 0.01, *** P< 0.001.
Fig. 3
Fig. 3. Hepatic TG levels after feeding with a HFD
TG levels were measured in liver from 6-month-old mice by two independent methods, (A) TLC (representative result of 3 independent experiments) and (B) a colorimetric assay (n=3). (C) Hematoxylin & eosin staining. The nodule is from a CerS2 null mouse. Scale bar, 100 μm. (D) Serum TG and (E) FFA levels (n=3). ChE, cholesterol ester; Ch, cholesterol; DAG, diacylglycerol. Data are means ± S.E.M.* P< 0.05, ** P< 0.01, *** P< 0.001.
Fig. 4
Fig. 4. Intestinal TG absorption and hepatic fatty acid oxidation
(A) Distribution of [3H]-Triolein in 2-month-old CerS2 null mouse intestine (n=3). (B) Plasma radioactivity after administration of tyloxapol and [3H]-Triolein (n=3). (C) Fatty acid oxidation in 2–3-month-old WT and CerS2 null mice liver (n=4). * P< 0.05, *** P<0.001.
Fig. 5
Fig. 5. FFA uptake in CerS2 null mouse liver
(A) BODIPY-palmitate (green) uptake into hepatocytes isolated from 2–3-month-old WT and CerS2 null mice. Nuclei were labeled with DAPI (blue). This experiment was repeated 4 times with similar results. Scale bar, 20 μm. (B) [9,10-3H (N)]-palmitate uptake into mouse tissues upon its injection into the tail vein (n=4). Data are means ± S.E.M. * P< 0.05, ** P< 0.01.
Fig. 6
Fig. 6. Expression of proteins involved in hepatic FFA uptake
(A) mRNA expression in 2-month-old WT and CerS2 null mice (n=3). Data are show as fold-change versus WT and are means ± S.E.M. * P< 0.05, ** P< 0.01, *** P< 0.001. FATP5, fatty acid transport protein 5; FSP27, fat specific protein 27; FABP1, fatty acid binding protein 1; FABPpm, plasma membrane fatty acid binding protein. (B) Western blots of homogenates from 2-month-old WT and CerS2 null mouse liver. Western blots of Hep3b cells after transfection with either (C) siRNA to CerS2, (D) CerS5 or (E) CerS6. Western blots were repeated at least 3 times and gave similar results.
Fig. 7
Fig. 7. Effects of VLC-ceramides on CD36/FAT expression
Hepatocytes from 2-month-old mice were treated with various acyl chain length ceramides. (A) mRNA expression levels of PPAR-γ and CD36/FAT (n=3). (B) Protein level of CD36/FAT. Western blots were repeated at least 3 times and gave similar results. (C) Protein level of CD36/FAT in 2-month-old CerS2 null hepatocyte after C24-ceramide treatment. Western blots were repeated at least 3 times and gave similar results. Data are means ± S.E.M., * P< 0.05, ** P< 0.01, *** P< 0.001.
Fig. 8
Fig. 8. Distribution of CD36/FAT and FATP5 in DRM fractions
DRM fractions from 2-month-old (A) WT and (B) CerS2 null mouse liver analyzed by Western blotting. The experiment was repeated at least 3 times and gave similar results. (C) Intracellular location of CD36/FAT and FATP5 in hepatocytes isolated from 2-month-old WT and CerS2 null mouse after treatment with 80 mU/l insulin. Scale bar, 20 μm. This experiment was repeated 4 times with similar results. (D) Subcellular fractionation of CD36/FAT in hepatocytes from 2-month-old WT and CerS2 null mice upon insulin treatment. This experiment was repeated 3 times with similar results. Cyt, cytoplasmic fraction; Mem, membrane fraction.
Fig. 9
Fig. 9. Impaired CD36/FAT translocation is not due to hepatic insulin resistance
(A) Phosphorylation of insulin receptor β and (B) CD36/FAT translocation of hepatocytes isolated from 2-month-old WT, CerS2 null mice upon 10 nM or 100 nM insulin treatment. Scale bar, 20 μm. This experiment was repeated 4 times with similar results.
Fig. 10
Fig. 10. Effect of rAAV-CerS2 infection on protein levels and on FFA uptake
rAAV-GFP and rAAV-CerS2 were injected via the tail vein to 6–7-week-old WT and CerS2 null mice. (A) Protein expression analyzed by Western blotting. This experiment was repeated 3 times with similar results. (B) Quantification of CerS2 and CD36/FAT levels (n=3). Data are means ± S.E.M. * P< 0.05, ** P< 0.01, *** P< 0.001. (C) TG and lipid levels. This experiment was repeated 3 times with similar results. (D) Quantification of TG levels. Data are means ± S.E.M. * P< 0.05. (n=3) (E) Uptake of BODIPY-palmitate into hepatocytes isolated from WT and CerS2 null mice. This experiment was repeated twice with similar results. Scale bar, 20 μm.
Fig. 11
Fig. 11. Effect of rAAV-CerS2 infection on distribution of CD36/FAT and FATP5
DRM fractions from 4-month-old CerS2 null mouse liver infected with either (A) rAAV-GFP or (B) rAAV-CerS2 analyzed by Western blotting. The experiment was repeated at least 3 times and gave similar results. The location of DRMs is indicated. (C) Intracellular location of CD36/FAT upon treatment with 80 mU/l insulin of hepatocytes isolated from 4-month-old WT, CerS2 null and CerS2 null mouse liver after rAAV-CerS2 infection. Scale bar, 20 μm. This experiment was repeated 3 times with similar results.

References

    1. Pohl J, Ring A, Ehehalt R, Herrmann T, Stremmel W. New concepts of cellular fatty acid uptake: role of fatty acid transport proteins and of caveolae. Proc Nutr Soc. 2004;63:259–262. doi: 10.1079/PNS2004341. - DOI - PubMed
    1. Abumrad N, Coburn C, Ibrahimi A. Membrane proteins implicated in long-chain fatty acid uptake by mammalian cells: CD36, FATP and FABPm. Biochim Biophys Acta. 1999;1441:4–13. - PubMed
    1. Doege H, Baillie RA, Ortegon AM, Tsang B, Wu Q, Punreddy S, et al. Targeted deletion of FATP5 reveals multiple functions in liver metabolism: alterations in hepatic lipid homeostasis. Gastroenterology. 2006;130:1245–1258. doi: 10.1053/j.gastro.2006.02.006. - DOI - PubMed
    1. van Oort MM, van Doorn JM, Bonen A, Glatz JFC, van der Horst DJ, Rodenburg KW, et al. Insulin-induced translocation of CD36 to the plasma membrane is reversible and shows similarity to that of GLUT4. Biochim Biophys Acta. 2008;1781:61–71. doi: 10.1016/j.bbalip.2007.11.006. - DOI - PubMed
    1. Luiken JJFP, Koonen DPY, Willems J, Zorzano A, Becker C, Fischer Y, et al. Insulin stimulates long-chain fatty acid utilization by rat cardiac myocytes through cellular redistribution of FAT/CD36. Diabetes. 2002;51:3113–3119. - PubMed

Publication types

LinkOut - more resources