. 2014 Oct 13;26(4):465-78.
doi: 10.1016/j.ccr.2014.07.025. Epub 2014 Sep 18.

TIPE3 is the transfer protein of lipid second messengers that promote cancer

Affiliations

TIPE3 is the transfer protein of lipid second messengers that promote cancer

Svetlana A Fayngerts et al. Cancer Cell. .

Abstract

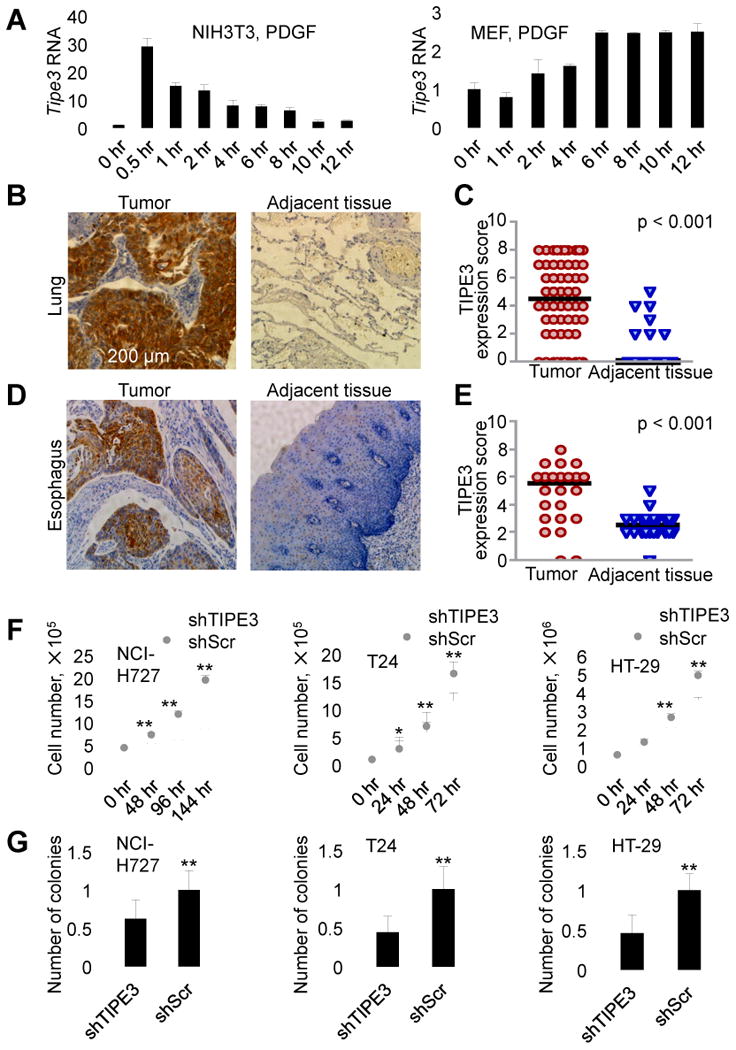
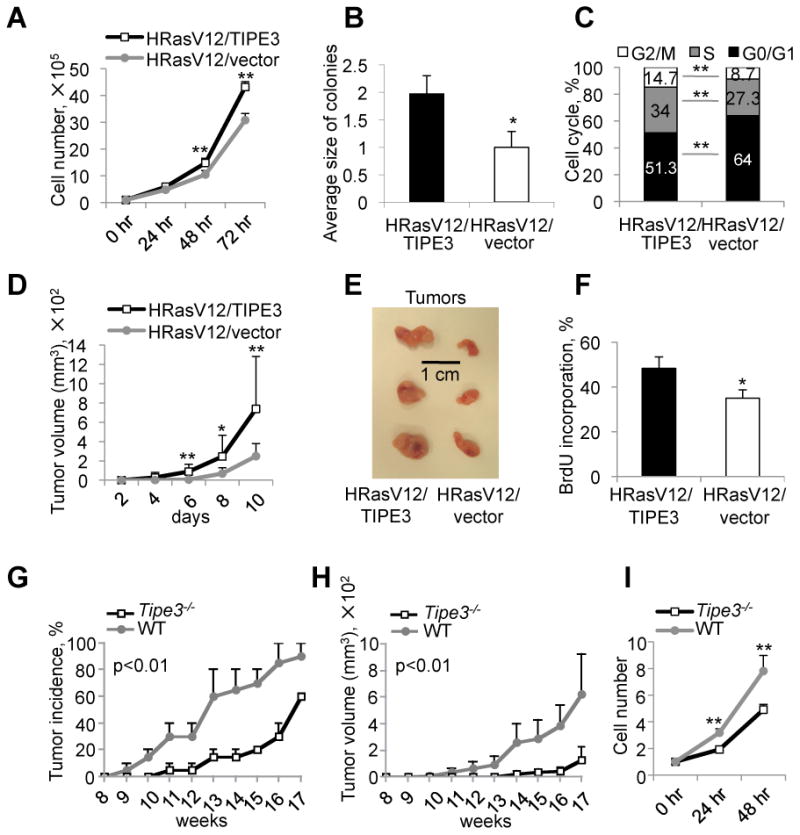
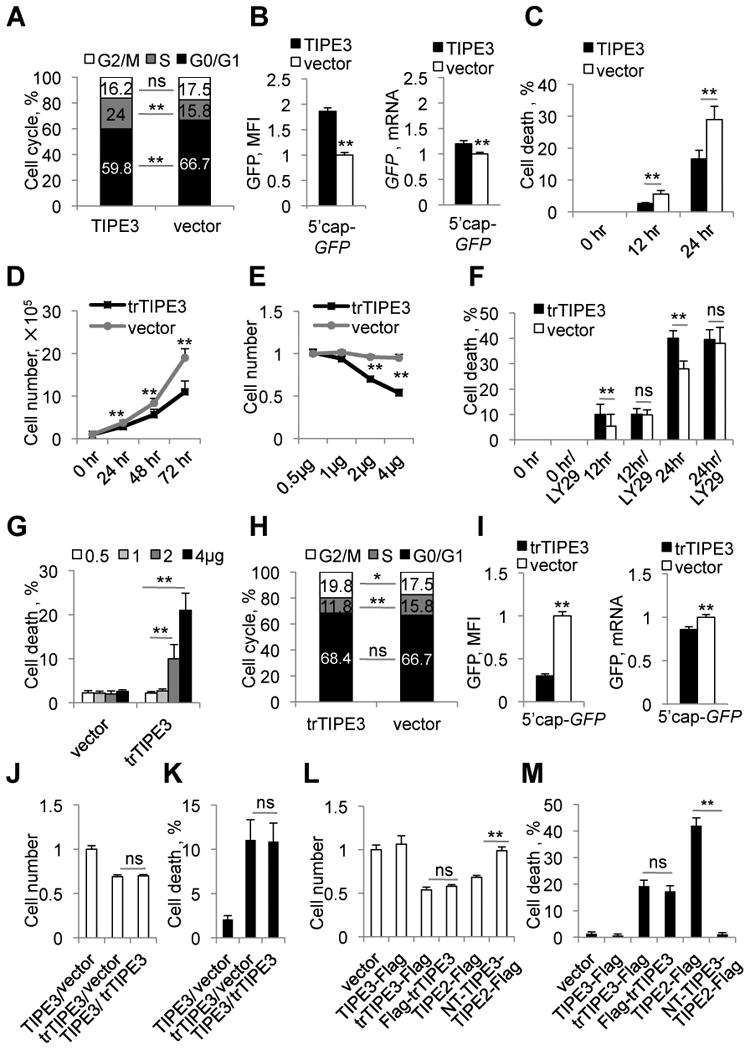
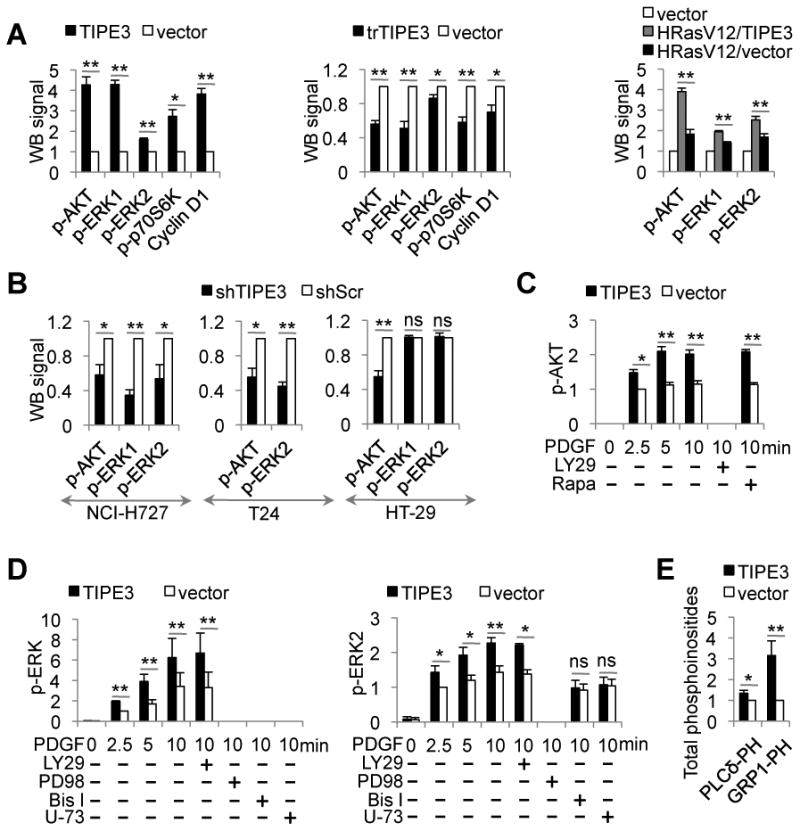
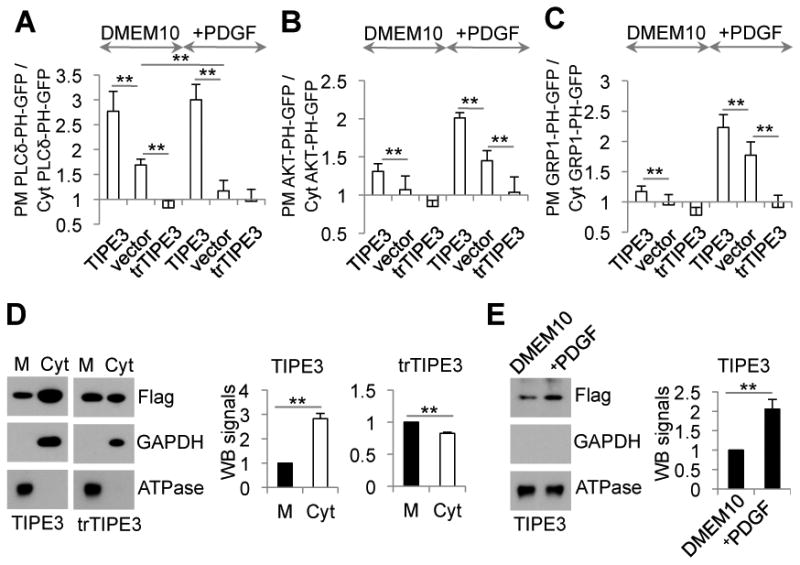
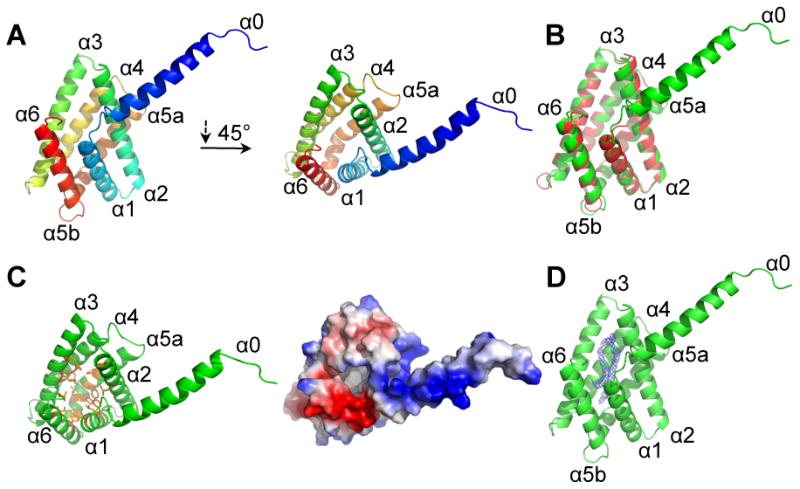
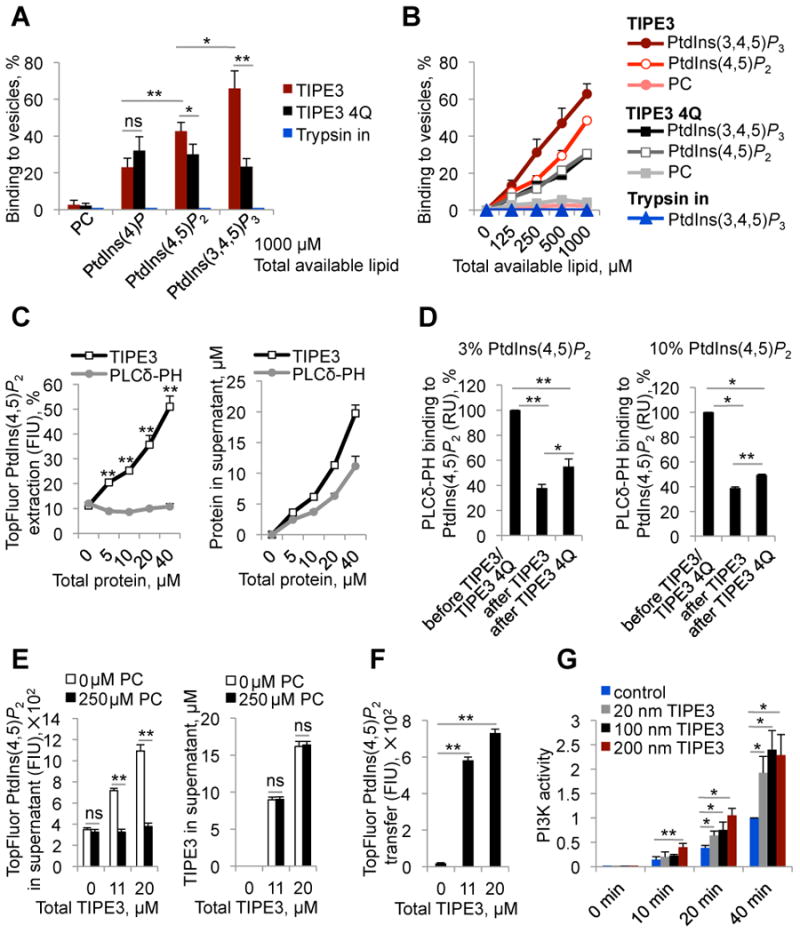
More than half of human cancers have aberrantly upregulated phosphoinositide signals; yet how phospholipid signals are controlled during tumorigenesis is not fully understood. We report here that TIPE3 (TNFAIP8L3) is the transfer protein of phosphoinositide second messengers that promote cancer. High-resolution crystal structure of TIPE3 shows a large hydrophobic cavity that is occupied by a phospholipid-like molecule. TIPE3 preferentially captures and shuttles two lipid second messengers, i.e., phosphatidylinositol 4,5-bisphosphate and phosphatidylinositol 3,4,5-trisphosphate, and increases their levels in the plasma membrane. Notably, human cancers have markedly upregulated TIPE3 expression. Knocking out TIPE3 diminishes tumorigenesis, whereas enforced TIPE3 expression enhances it in vivo. Thus, the function and metabolism of phosphoinositide second messengers are controlled by a specific transfer protein during tumorigenesis.


Figures

Figure 1
Figure 1. Upregulation of TIPE3 expression correlates with tumorigenesis
(A) RT-PCR analyses of TIPE3 mRNA levels in the NIH3T3 fibroblast cell line (left panel) and C57BL/6 murine embryonic fibroblasts (MEF, right panel). Cells were first serum-starved for 12 hr and then stimulated with 20 (left panel) and 50 (right panel) ng/ml of PDGF for the indicated times before being collected for the RNA analyses. The expression levels of TIPE3 in NIH3T3 (right panel) and MEF (left panel) at 0 hr were set as 1. (B-E) TIPE3 upregulation in human cancers. Immunohistochemistry analyses of TIPE3 protein expression in tumors and their adjacent normal tissues from patients diagnosed with lung cancer (B and C) and esophageal cancer (D and E). TIPE3-positive cells are shown in brown (B and D). Quantitation of the TIPE3 expression in tumors and adjacent tissues of 60 patients with lung cancer (C) and 24 patients with esophageal cancer (E) was performed as described in Supplemental Experimental Procedures. Each data point represents a TIPE3 expression score of patients. The horizontal bars represent the medians. (F) Cell growth analysis of human NCI-H727, T24, and HT-29 cells stably expressing either shTIPE3 or short hairpin scrambled (shScr) RNA (control) over the indicated times. (G) Soft agar colony formation of NCI-H727, T24, and HT-29 cells expressing either shTIPE3 or shScr. Numbers of colonies formed by cells expressing shScr were set as 1. For (A), (F), and (G), values represent means ± SD, * p < 0.05, and ** p < 0.01; h denotes hr. The experiments were repeated at least three times with similar results. See also Figure S1.
Figure 2
Figure 2. TIPE3 promotes tumorigenesis, cell growth, and cell survival in vitro and in vivo
(A-C) Analyses of cell growth (A), relative colony size in soft agar (B), and cell cycle progression (C) of NIH3T3-HRasV12 cells stably transfected with either TIPE3-Flag or empty vector. For (B), number of colonies formed by NIH3T3-HRasV12 cells transfected with empty vector was set as 1. The experiments were repeated at least three times with similar results. Values represent means ± SD. (D-F) TIPE3 promotes tumor growth in a murine xenograft model. Nude mice (n=14) were injected subcutaneously with NIH3T3-HRasV12 cells stably transfected with either TIPE3-Flag or empty vector. Tumor volume was determined over a course of 10 days (D). At day 10, tumors were excised and photographed (E). In vivo cell proliferation was analyzed by BrdU incorporation. The percentages of BrdU-positive cells in tumor sections are shown (F). Results are representative of two independent experiments. Values represent means ± SD. (G-I) Tipe3 deficiency reduces tumor growth in mice. Tipe3-/- mice and wild-type (WT) controls (n=15), 7 weeks of age, were injected subcutaneously with 3-methylcholanthrene. Tumor incidence was examined for up to 17 weeks (G). Data are pooled from two independent experiments. Tumor volume was monitored for up to 17 weeks (H). Results are representative of two independent experiments. Values represent means ± SEM; the p values shown are for differences after week 11. Growth of Tipe3-/- and wild-type fibrosarcoma cells over the indicated times (I). Data are pooled from three independent Tipe3-/- and two independent wild-type fibrosarcoma cell cultures established from different 3-methylcholanthrene-induced tumors. The cell numbers at 0 hr was set as 1. The experiments were repeated four times with similar results. Values represent means ± SD. For all panels, * p<0.05, and ** p<0.01; h denotes hr, d denotes days. See also Figure S2.
Figure 3
Figure 3. The N-terminal region of TIPE3 is essential for its ability to promote cell growth and survival
(A) Cell cycle analysis of NIH3T3 cells stably transfected with either TIPE3-Flag or empty vector. (B) 293T cells were co-transfected with pEGFP-C3 (5′cap-GFP, for cap-dependent translation) and either TIPE3-Flag-expressing or empty vector. The relative levels of GFP protein expression 32 hr after transfection were quantified by measuring the cellular mean fluorescence intensity (MFI) (left panel), whereas the relative levels of GFP mRNA were determined by real-time PCR (right panel). Protein and mRNA levels of cells transfected with empty vector were set as 1. (C) NIH3T3 cells stably transfected with either TIPE3-Flag or empty vector were cultured in serum-free medium for the indicated times, and cell death was assessed by trypan blue staining. (D) Cell growth of NIH3T3 cells stably transfected with either trTIPE3-Flag or empty vectors over indicated times. (E) Relative numbers of 293T cells transfected with the indicated amounts of trTIPE3-Flag plasmid or empty vector were determined 32 hr after transfection. Number of 293T cells transfected with 0.5 μg of empty vector was set as 1. (F) NIH3T3 cells stably transfected with either trTIPE3-Flag or empty vectors were cultured in serum-free medium with or without LY29 (LY29004) for the indicated times. Cell death was assessed by trypan blue staining. (G) Cell death of 293T cells transfected with the indicated amounts of trTIPE3-Flag plasmid or empty vector were assessed by trypan blue staining. (H) Cell cycle analysis of NIH3T3 cells stably transfected with either trTIPE3-Flag or empty vectors. (I) 293T cells were co-transfected with pEGFP-C3 and either trTIPE3-Flag-expressing or empty vectors. The relative levels of GFP protein expression 16 hr after transfection were quantified by measuring cellular MFI, whereas the relative levels of the GFP mRNA expression were determined by real-time PCR. Protein and mRNA levels of cells transfected with empty vector were set as 1. (J and K) 293T cells were co-transfected with equal amounts (2 μg) of the following plasmids as indicated: empty vectors, TIPE3-Flag- or trTIPE3-Flag-expressing vectors. Relative cell numbers were determined (J), and the degree of cell death (K) was assessed by trypan blue staining 32 hr later. For (J), number of 293T cells transfected with empty vector was set as 1. (L and M) 293T cells were transfected with one of the following plasmids as indicated: empty vector, TIPE3-Flag, trTIPE3-Flag, Flag-trTIPE3, TIPE2-Flag, NT-TIPE3-TIPE2-Flag (TIPE2-Flag fused with the NT region of TIPE3). Relative cell numbers were determined (L), and the degree of cell death (M) was assessed by trypan blue staining 32 hr later. For (L), number of 293T cells transfected with empty vector was set as 1. Y-axis values represent means ± SD; ns denotes not significant; * p<0.05, and ** p< 0.01; h denotes hr. The experiments were performed in duplicates and repeated at least three times with similar results. See also Figure S3.
Figure 4
Figure 4. TIPE3 promotes the activation of PI3K-AKT and MEK-ERK pathways
(A) Whole cell lysates were prepared from NIH3T3 cells stably transfected with TIPE3-Flag, trTIPE3-Flag, or empty vectors (left two panels), or TIPE3-Flag and/or HRasV12 vectors (right panel). Western blot (WB) was performed using antibodies against the indicated proteins. The densitometric quantification of protein signals was made using ImageJ software. Signals of cells transfected with empty vector were set as 1. (B) Whole cell lysates were prepared from NCI-H727, T24, and HT-29 cells stably expressing either shTIPE3 or shScr. Western blot was performed using antibodies against the indicated proteins. Signals of cells treated with shScr were set as 1. (C and D) NIH3T3 cells stably transfected with either TIPE3-Flag or empty vectors were serum-starved, and then stimulated with 40 ng/ml of PDGF for the indicated times, with or without the following inhibitors: LY29 (LY29004), Rapa (Rapamycin), PD98 (PD98059), Bis I (Bisindolylmaleimide I), or U-73 (U-73122). Lysates of these cells were used for Western blot with antibodies against the indicated proteins. Signals of cells transfected with vector 2.5 min after PDGF stimulation were set as 1. (E) Cellular levels of PtdIns(4,5)P2 and PtdIns(3,4,5)P3 in NIH3T3 cells stably transfected with either TIPE3-Flag or empty vector were estimated by protein-lipid overlay assay with GST-PLCδ-PH and GST-GRP1-PH domains as described in Supplemental Experimental Procedures. Signals of cells transfected with empty vector were set as 1. Y-axis values represent means ± SD; ns denotes not significant; * p<0.05, and ** p< 0.01. p- indicatedes phosphorylated. The experiments were performed at least three times with similar results. See also Figure S4.
Figure 5
Figure 5. TIPE3 regulates lipid metabolism and signaling
(A-C) NIH3T3 cells were co-transfected with (A) PLCδ-PH-GFP, (B) AKT-PH-GFP, or (C) GRP1-PH-GFP and one of the following plasmids as indicated: pRK5 vector (vector), pRK5-TIPE3-Flag (TIPE3), and pRK5-trTIPE3-Flag (trTIPE3). Thirty-two hr after the transfection, cells were cultured in DMEM with 10% FCS (DMEM10, A-C), or in DMEM10 with 40 ng/ml of PDGF for 5.5 min (+PDGF, A), or serum-starved for 4 hr and then cultured in DMEM containing 40 ng/ml of PDGF for 7.5 min (+PDGF, B and C) followed by fixation. Cells expressing the Flag-tagged proteins were selected by immunofluorescence microscopy with an anti-Flag antibody. Ratios of GFP fluorescence intensity on plasma membrane (PM) over that in the cytoplasm (Cyt) of the same cells are calculated based on line fluorescence intensity profiles. (D) Membrane (M) and cytoplasmic (Cyt) proteins fractions were prepared from NIH3T3 cells stably transfected with TIPE3-Flag and trTIPE3-Flag. Western blot was performed using antibodies against the indicated proteins. Signals of TIPE3 or trTIPE3 in membrane fractions were set as 1. (E) NIH3T3 cells stably transfected with TIPE3-Flag were cultured in DMEM with 10% of FCS (DMEM10) or serum-starved for 4 hr and then cultured in DMEM containing 40 ng/ml of PDGF for 7.5 min (+PDGF). Membrane protein fractions (M) of these cells were analyzed by Western blot using antibodies against the indicated proteins. Signals of TIPE3 in membrane fractions of cells cultured in DMEM10 were set as 1. For (A-E), values represent means ± SD; **p<0.01. The experiments were repeated at least three times with similar results. See also Figure S5.
Figure 6
Figure 6. The crystal structure of the TH-domain of human TIPE3
(A) Cartoon presentation of TH-domain of human TIPE3 (trTIPE3, residues 21-204). Helices are rainbow-colored with α0 in blue and α6 in red. (B) Cartoon representation of superposition of human TIPE3 (residues 21-204, shown in green) with the human TIPE2 (residues 24-184, shown in red) structures. (C) TIPE3 contains a centrally located hydrophobic cavity. (Left panel) TIPE3 is shown in green cartoon representation; amino acids with hydrophobic side chains that line the cavity are shown in orange. (Right panel) TIPE3 eletrostatic surface potential: blue, positive; red, negative. (D) TIPE3 is shown in green cartoon representation. The two long connected tubes of 2Fo-Fc electron density found in TIPE3 cavity is shown in blue mesh, contoured at 1.5σ. See also Table S1 and Figure S6.
Figure 7
Figure 7. TIPE3 is a phosphoinositide transfer protein
(A and B) The sedimentation-based binding assay was used to determine the percentages of TIPE3, TIPE3 4Q, and control protein trypsin inhibitor (Trypsin in) bound to vesicles containing 10% PtdIns(4)P+90% PC [10% PtdIns(4)P], 10% PtdIns(3,4,5)P3+90% PC [10% PtdIns(3,4,5)P3], 10% PtdIns(4,5)P2+90% PC [10% PtdIns(4,5)P2], or 100% PC as indicated. Proteins were used at a concentration of 20 μM. (C) The sedimentation-based extraction assay was used to determine (i) the percentages of TopFluorPtdIns(4,5)P2 extracted from 100 μM 20% TopFluorPtdIns(4,5)P2+80% PC vesicles and transferred to supernatant by TIPE3 and PLCδ-PH (left panel), and (ii) fractions of TIPE3 and PLCδ-PH proteins not bound to the 20% TopFluorPtdIns(4,5)P2+80% PC vesicles (right panel). (D) In the SPR-based assay, 3% (left panel) and 10% (right panel) PtdIns(4,5) P2-containing vesicles were immobilized on L1 sensor chips, and the binding signal obtained with a saturating injection of GST-PLCδ-PH (5 μM) was measured before and after TIPE3 or TIPE3 4Q (both at 40 μM) had been flowed over the sensor chip. GST-PLCδ-PH binding to PtdIns(4,5)P2-containing surfaces before TIPE3 or TIPE3 4Q exposure is set as 100% and GST-PLCδ-PH binding to PtdIns(4,5) P2-containing surfaces after TIPE3 or TIPE3 4Q exposure is presented as the percentage reduction. (E) The sedimentation-based transfer assay was used to measure the depletion of TopFluorPtdIns(4,5)P2 from soluble TIPE3-TopFluorPtdIns(4,5)P2 in supernatants (left panel) and fractions of TIPE3 remaining in supernatants (right panel) after incubation with 100% PC vesicles or buffer alone. (F) The sedimentation-based transfer assay was used to monitor the transfer of TopFluorPtdIns(4,5)P2 from soluble TIPE3-TopFluorPtdIns(4,5)P2 in supernatants to 100% PC vesicles. (G) Time course of PI3K (p110α/p85α)-mediated phosphorylation of PtdIns(4,5)P2 in the absence or presence of TIPE3 at indicated concentrations. The levels of PtdIns(3,4,5)P3 were measured by protein-lipid overlay assay with GST-GRP1-PH domain. PI3K activity determined at 40 min in the absence of TIPE3 was set to 1. FIU, fluorescence intensity units; RU, resonance units. Values represent means ± SD; ns denotes not significant; * p<0.05, and ** p<0.01. For (A-F), the experiments were repeated at least three times with similar results. For (G), the experiments were performed in triplicates and repeated two times with similar results. See also Figure S7.

References

    1. Ahn SH, Deshmukh H, Johnson N, Cowell LG, Rude TH, Scott WK, Nelson CL, Zaas AK, Marchuk DA, Keum S, et al. Two genes on A/J chromosome 18 are associated with susceptibility to Staphylococcus aureus infection by combined microarray and QTL analyses. PLoS Pathog. 2010;6:e1001088. - PMC - PubMed
    1. Bankaitis VA, Mousley CJ, Schaaf G. The Sec14 superfamily and mechanisms for crosstalk between lipid metabolism and lipid signaling. Trends Biochem Sci. 2010;35:150–160. - PMC - PubMed
    1. de Saint-Jean M, Delfosse V, Douguet D, Chicanne G, Payrastre B, Bourguet W, Antonny B, Drin G. Osh4p exchanges sterols for phosphatidylinositol 4-phosphate between lipid bilayers. J Cell Biol. 2011;195:965–978. - PMC - PubMed
    1. Ferguson KM, Kavran JM, Sankaran VG, Fournier E, Isakoff SJ, Skolnik EY, Lemmon MA. Structural basis for discrimination of 3-phosphoinositides by pleckstrin homology domains. Molecular cell. 2000;6:373–384. - PubMed
    1. Fruman DA, Meyers RE, Cantley LC. Phosphoinositide kinases. Annu Rev Biochem. 1998;67:481–507. - PubMed

Publication types