. 2014 Oct 23;56(2):205-218.
doi: 10.1016/j.molcel.2014.08.018. Epub 2014 Sep 18.

Asparagine plays a critical role in regulating cellular adaptation to glutamine depletion

Affiliations

Asparagine plays a critical role in regulating cellular adaptation to glutamine depletion

Ji Zhang et al. Mol Cell. .

Abstract

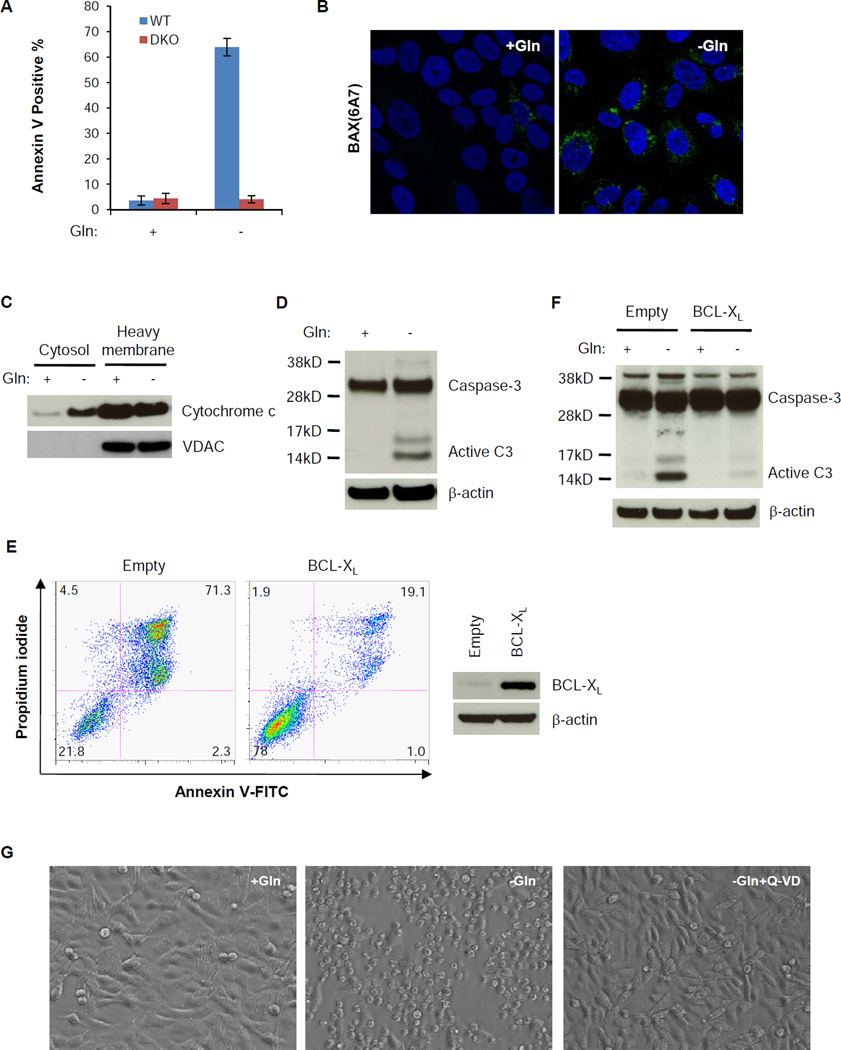
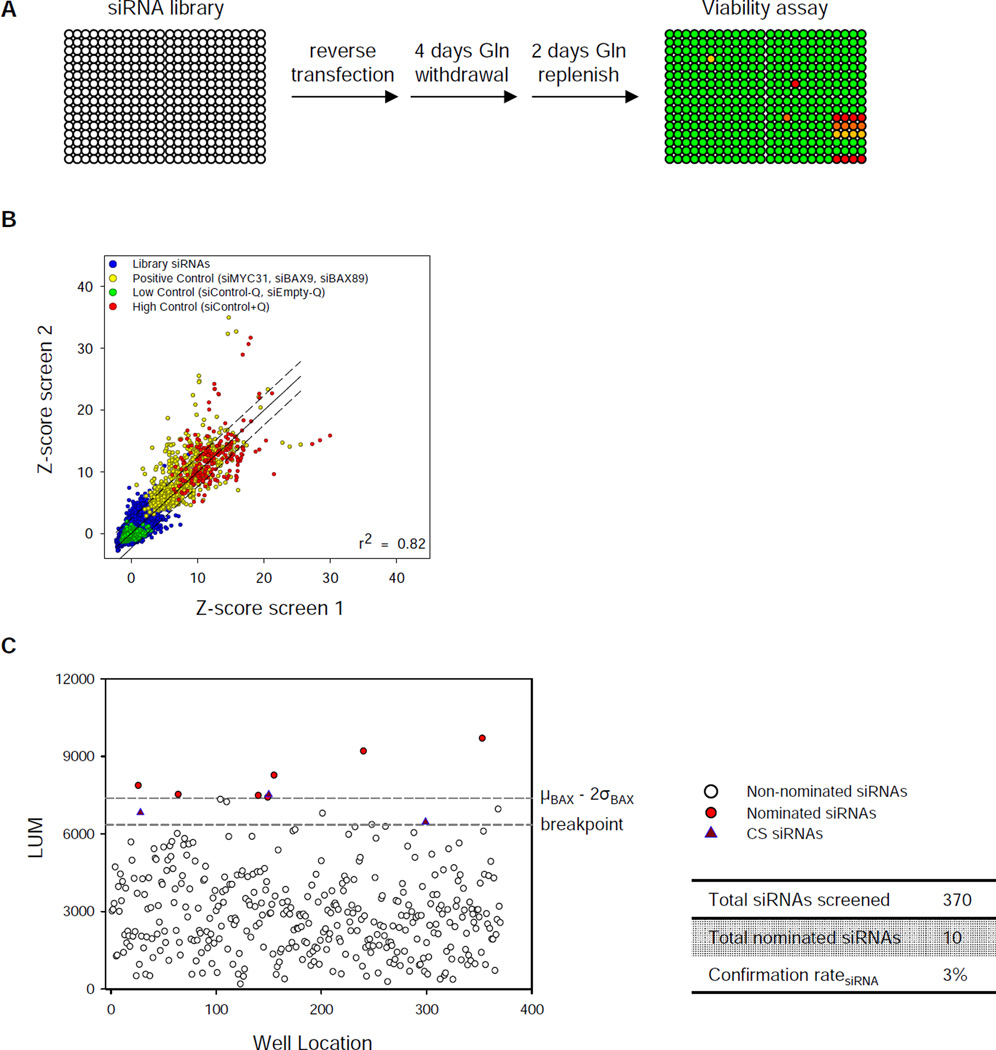
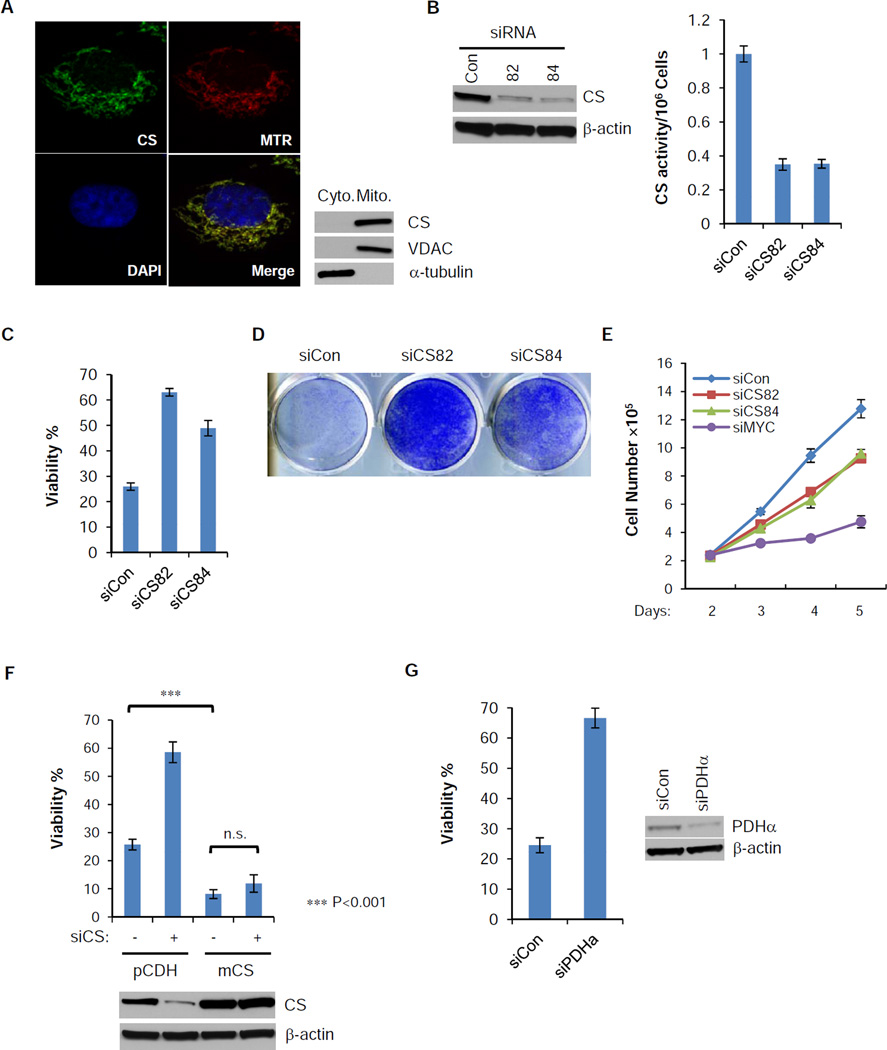
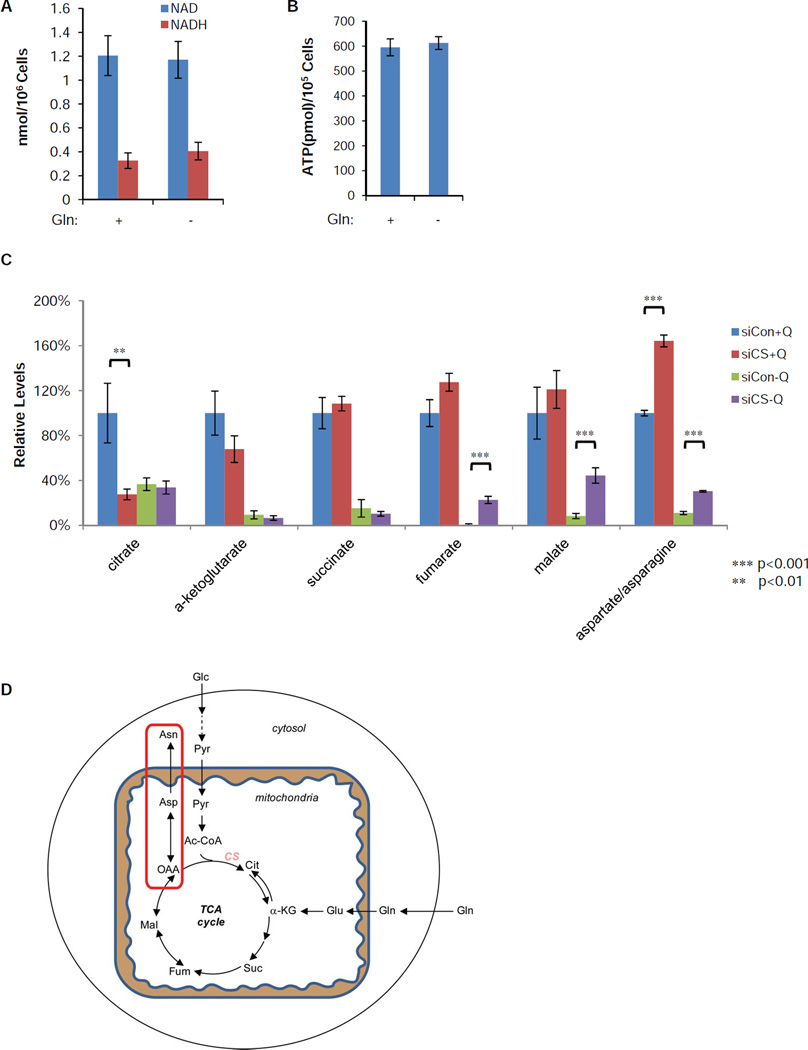
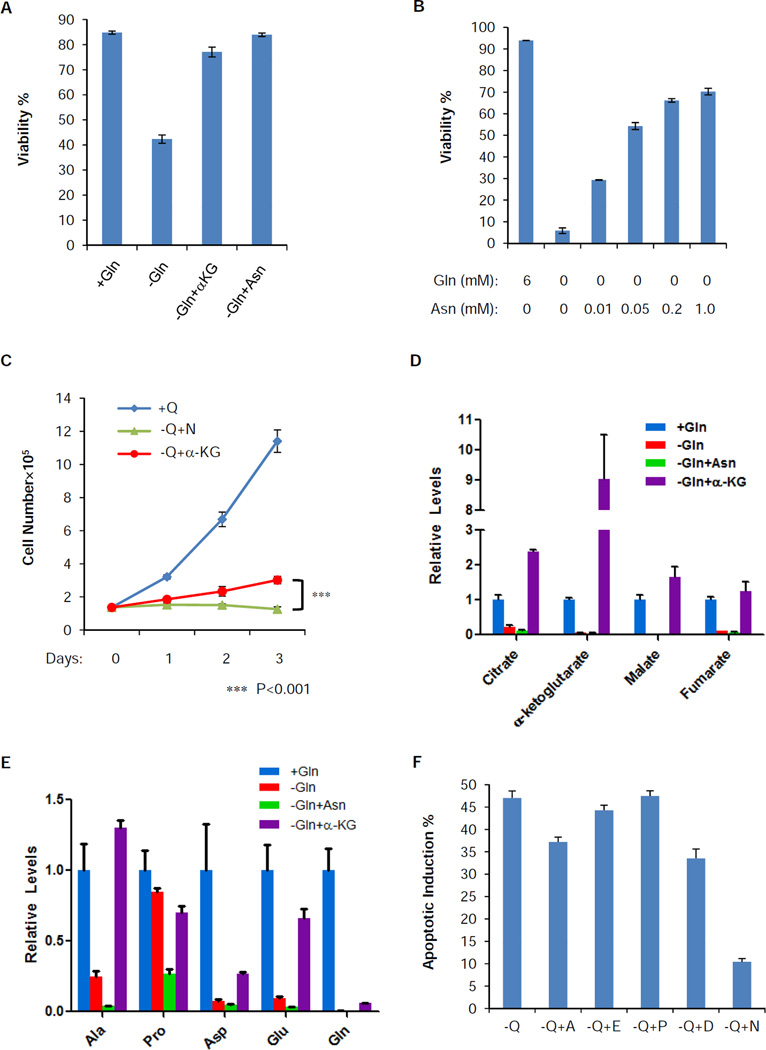
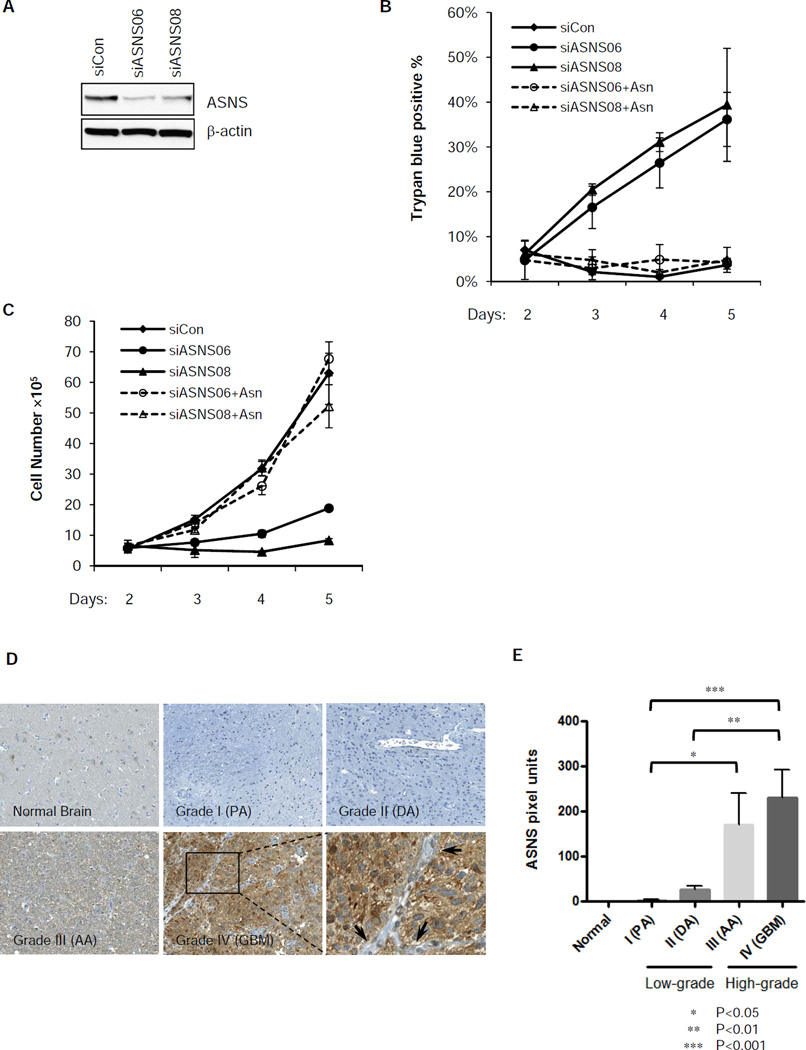
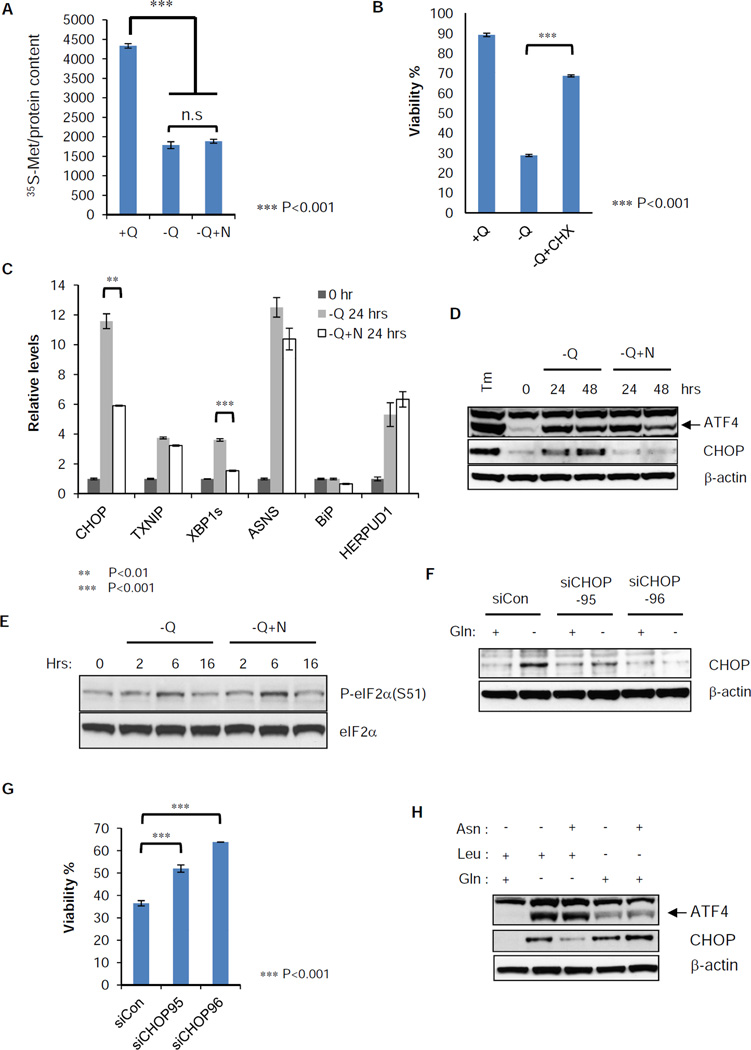
Many cancer cells consume large quantities of glutamine to maintain TCA cycle anaplerosis and support cell survival. It was therefore surprising when RNAi screening revealed that suppression of citrate synthase (CS), the first TCA cycle enzyme, prevented glutamine-withdrawal-induced apoptosis. CS suppression reduced TCA cycle activity and diverted oxaloacetate, the substrate of CS, into production of the nonessential amino acids aspartate and asparagine. We found that asparagine was necessary and sufficient to suppress glutamine-withdrawal-induced apoptosis without restoring the levels of other nonessential amino acids or TCA cycle intermediates. In complete medium, tumor cells exhibiting high rates of glutamine consumption underwent rapid apoptosis when glutamine-dependent asparagine synthesis was suppressed, and expression of asparagine synthetase was statistically correlated with poor prognosis in human tumors. Coupled with the success of L-asparaginase as a therapy for childhood leukemia, the data suggest that intracellular asparagine is a critical suppressor of apoptosis in many human tumors.


Figures

Figure 1
Figure 1. Glutamine depletion induces apoptotic cell death through the BCL2 proteins and caspase
(A) Wild type (WT) and Bax−/−;Bak−/− (DKO) MEFs were cultured in DMEM without glutamine for 4 days. Percentage of dead cells was defined by Annexin V positive staining. Data are represented as mean +/− S.D., n=3. (B) SF188 cells were cultured with or without glutamine for 48 hours in the presence of 20 µM Q-VD. Cells were stained with an antibody recognizing N-terminally exposed, activated BAX (Green) and Hoechst nuclear stain (Blue). (C, D) Cytochrome C release and caspase-3 activation in SF188 cells 24 hours after glutamine depletion. VDAC was used as a marker of mitochondrial fraction. (E, F) SF188 cells with constitutively overexpressed BCL-XL were starved of glutamine for 48 hours. Cells were collected for Annexin V and PI staining or for western blotting of caspase-3 activation. (G) SF188 cells were deprived of glutamine with or without pan-caspase inhibitor Q-VD (20 µM) for 48 hours. Images were captured with a Leica DM IRBE fluorescence microscope with a bright field at 40X.
Figure 2
Figure 2. High throughput RNAi screen identifies citrate synthase (CS) siRNA as a suppressor of glutamine withdrawal-induced apoptosis
(A) Schematic representation of the screening strategy in MYC-amplified SF188 human glioblastoma cell line. The right lower corner of each plate is where the positive and negative controls are spotted. (B) Scatter plot of robust z-scores of the primary screen performed in duplicate. Blue: total library siRNAs without glutamine; Green: negative control siRNAs or no siRNA without glutamine; Yellow: positive control siRNAs against MYC or BAX without glutamine; Red: positive control of scrambled siRNA with glutamine. “−” or “+” Q denotes glutamine status. Dashed line: ± 2 times of the standard deviation (σ) of difference of each data between the real value and the regression value. (C) Secondary screen of 119 candidates. See extended experimental procedures for the definition of breakpoint cutoff. See also Figure S1.
Figure 3
Figure 3. Loss of function of CS protects cells from glutamine withdrawal-induced apoptosis
(A) SF188 cells were stained with mitoTracker Red (Red), and then fixed and stained with antibody against CS (Green). DAPI (Blue) was applied for nuclear staining. Cytosolic and heavy membrane fractions of SF188 cells were isolated. Distribution of CS was confirmed by western blotting, with VDAC and α-tubulin as mitochondrial and cytosolic markers. (B) siRNA suppression of CS for 48 hours in SF188 cells reduces both the protein level and the enzymatic activity. (C,D) SF188 cells were transfected with control or CS siRNA for 2 days and glutamine was deprived for another 48 hours. Viability was measured by Annexin V & PI staining. Crystal violet staining was used to measure total viable cells after 4 days of glutamine depletion followed by re-addition of glutamine for an additional 2 days. (E) SF188 cells were transfected with control, CS or MYC siRNA in DMEM medium with glutamine, cell numbers were recorded from day 2 to 5 post-transfection. (F) SF188 cells with constitutively expressed mouse CS (mCS) or empty vector (pCDH) were transfected with control or human CS siRNA for 2 days, and then deprived of glutamine for 48 hours. Viability was measured by Annexin V and PI staining, and expression of total CS was measured by western blotting. p-value was determined by using Student’s 2-tailed t-test. (G) SF188 cells were transfected with control or pyruvate dehydrogenase subunit α (PDHα) siRNA for 2 days, and then deprived of glutamine for 48 hours. Viability was measured by Annexin V and PI staining. The data in Figure 3 (B, C, E, F and G) are shown as mean +/− S.D., n=3. See also Figure S2.
Figure 4
Figure 4. CS knockdown redirects oxaloacetate (OAA) to aspartate and asparagine synthesis
(A, B) SF188 cells were deprived of glutamine for 16 hours. Total NAD, NADH and ATP levels in viable cells were measured and normalized to cell number. Data are shown as mean +/− S.D., n=3. (C) SF188 cells were transfected with control or CS siRNA for 2 days, and then cultured in DMEM medium with (+Q) or without (−Q) glutamine for 16 hours. Intracellular citrate, α-ketoglutarate, succinate, fumarate, malate and aspartate/asparagine were quantified by LC-MS and normalized to cellular protein content. Data are represented as mean +/−S.D., n=3, and the p-values are determined by using Student’s 2-tailed t-test. (D) Schematic diagram shows that CS knockdown redirects OAA to aspartate and asparagine biosynthesis. Abbreviations: Glc, glucose; Pyr, pyruvate; Ac-CoA, acetyl-CoA; Gln, glutamine; Glu, glutamate; Cit, citrate; α-KG, α-ketoglutarate; Suc, succinate; Fum, fumarate; Mal, malate; OAA, oxaloacetate; Asp, aspartate; Asn, asparagine. See also Figure S3.
Figure 5
Figure 5. Extracellular asparagine completely restores the viability, but not the TCA cycle intermediates, other nonessential amino acids or proliferation, in the absence of glutamine
(A) SF188 cells were cultured in DMEM with the following modification: +Gln, −Gln, −Gln+αKG (5 mM) and -Gln+Asn (4 mM) for 48 hours. Viability was measured by Annexin V and PI staining. Data are shown as mean +/− S.D., n=3. (B) SF188 cells were cultured in DMEM without glutamine in the presence of various concentrations of asparagine for 4 days. Viability was measured by Annexin V and PI staining. Data are shown as mean +/− S.D., n=3. (C) SF188 cells were grown in DMEM with the following modification: +Q, −Q+N (4 mM) and −Q+αKG (5 mM) for 3 days and cell number was recorded. Data are shown as mean +/− S.D., n=3. The p-value was determined by using Student’s 2 tailed t-test. (D) SF188 cells were cultured in the same conditions as panel (A) for 16 hours. Intracellular citrate, α-ketoglutarate, malate and fumarate were quantified by GC-MS and normalized to cellular protein content. Data are shown as mean + S.D., n=3. (E) SF188 cells were cultured in the same conditions as panel (A) for 16 hours. Intracellular levels of alanine (Ala), proline (Pro), aspartate (Asp), glutamate (Glu) and glutamine (Gln) were quantified by LC-MS and normalized to total cell volume. Data are shown as mean + S.D., n=3. (F) SF188 cells were cultured in DMEM in the absence of glutamine (−Q), individually supplemented with 0.2 mM alanine (−Q+A), glutamate (−Q+E), proline (−Q+P), aspartate (−Q+D), or asparagine (−Q+N). Apoptotic induction percentage was defined by Annexin V positive staining 2 days post medium change and then subtracted by the basal level (cells grown in complete DMEM with glutamine) of apoptotic rates. Data are shown as mean + S.D., n=3. See also Figure S4.
Figure 6
Figure 6. Expression of asparagine synthetase (ASNS) is required for glutamine-dependent survival and is correlated with poor prognosis in human glioma
(A) SF188 cells were transfected with siRNA targeting ASNS or control for 2 days. Knockdown of ASNS was confirmed by western blotting. (B) SF188 cells were transfected with control or ASNS siRNA for 48 hours, then cultured in DMEM with glutamine with or without extracellular asparagine (4 mM). Cell death was measured by Trypan blue staining from day 2 to 5 post-transfection. Data are shown as mean +/− S.D., n=3. (C) SF188 cells were transfected with control or ASNS siRNA and cultured in the same conditions as panel (B). Viable cell number was recorded from day 2 to 5 post-transfection by Trypan blue exclusion. Data are shown as mean +/− S.D., n=3. (D) Tissues from normal brain or tumors of glioma patients were stained for ASNS by immunohistochemistry. Representative images of each category, including normal brain, grade I (pilocytic astrocytomas, PA), grade II (diffuse astrocytomas, DA), grade III (anaplastic astrocytomas, AA) and grade IV (glioblastomas, GBM), were shown. A magnified region of ASNS staining of a GBM sample is provided, which shows cytoplasmic distribution of the staining. The arrow heads point to absence of staining of the vasculature within the tumor. (E) The intensity of ASNS staining based on pixel units of each image were quantified and summarized for each category. Data are shown as mean + S.E.M., normal brain (n=3), PA (n=3), DA (n=5), AA (n=10), GBM (n=31). See extended experimental procedures for definition of each category. All the p-values were determined by using Student’s 2 tailed t-test. See also Figure S5.
Figure 7
Figure 7. Induction of endoplasmic reticulum (ER) stress marker genes by glutamine withdrawal is suppressed by asparagine addition
(A) SF188 cells were grown in complete medium (+Q) or glutamine-deficient medium with (−Q+N) or without (−Q) asparagine (4 mM) for 16 hours, then switched to the same fresh medium without methionine. 0.1 mCi 35S-methionine was pulsed for 30 minutes and whole cell extract was prepared. Radioactivity of labeled protein was measured in a scintillation counter and normalized to total protein content. (B) SF188 cells were cultured 48 hours in DMEM with the following modifications: with glutamine (+Q), without glutamine (−Q) or without glutamine in the presence of cycloheximide (1 µg/mL) (−Q+CHX). Viability was measured by Annexin V and PI staining. (C) SF188 cells were cultured in DMEM without glutamine (−Q) or without glutamine but with asparagine (4 mM) (−Q+N) for 24 hours. Q-VD was added at 20 µM to prevent cell death. mRNA was extracted and Q-PCR was performed to detect relative abundance of ER stress marker genes, CHOP, TNXIP, XBP1s, ASNS, BiP and HERPUD1 normalized to 18s ribosomal RNA. (D) SF188 cells were cultured as in panel (C) for 48 hours. Protein extracts were prepared at 0, 24 and 48 hours for western blotting of ATF4 and CHOP. Tunicamycin (Tm) was added at 10 µg/ml for 4 hours as a positive control. (E) SF188 cells were switched to minus glutamine DMEM with (−Q+N) or without (−Q) asparagine (4 mM) for 16 hours. Protein extracts were prepared at 0, 2, 6 and 16 hours after medium change. Western blotting was performed for phospho-eIF2α (S51) and total eIF2α. (F) SF188 cells were transfected with control or CHOP siRNA for 2 days. Then glutamine was withdrawn for 24 hours in the presence of Q-VD (20 µM). Whole cell extracts were prepared for western blotting of CHOP. (G) SF188 cells were transfected with control or CHOP siRNA for 2 days. Then glutamine was withdrawn for 48 hours, and viability was measured by Annexin V staining. (H) SF188 cells were cultured in DMEM without glutamine (Gln) or leucine (Leu) individually. 4 mM asparagine (Asn) was added or not added to each amino acid deficient medium for 24 hours. Q-VD was added at 20 µM to prevent cell death and protein extract was prepared for western blotting of ATF4 and CHOP. The data in Figure 7 (A, B, C and G) are shown as mean +/− S.D., n=3, and the p-values are determined by using Student’s 2 tailed t-test. See also Table S1.

References

    1. Aslanian AM, Fletcher BS, Kilberg MS. Asparagine synthetase expression alone is sufficient to induce l-asparaginase resistance in MOLT-4 human leukaemia cells. Biochem J. 2001;357:321–328. - PMC - PubMed
    1. Avramis VI. Asparaginases: biochemical pharmacology and modes of drug resistance. Anticancer Res. 2012;32:2423–2437. - PubMed
    1. Balasubramanian MN, Butterworth EA, Kilberg MS. Asparagine synthetase: regulation by cell stress and involvement in tumor biology. Am J Physiol Endocrinol Metab. 2013;304:E789–E799. - PMC - PubMed
    1. Cheng T, Sudderth J, Yang C, Mullen AR, Jin ES, Mates JM, DeBerardinis RJ. Pyruvate carboxylase is required for glutamine-independent growth of tumor cells. Proc Natl Acad Sci U S A. 2011;108:8674–8679. - PMC - PubMed
    1. DeBerardinis RJ, Mancuso A, Daikhin E, Nissim I, Yudkoff M, Wehrli S, Thompson CB. Beyond aerobic glycolysis: transformed cells can engage in glutamine metabolism that exceeds the requirement for protein and nucleotide synthesis. Proc Natl Acad Sci U S A. 2007;104:19345–19350. - PMC - PubMed

Publication types

MeSH terms