. 2014 Oct 23;56(2):193-204.
doi: 10.1016/j.molcel.2014.08.020. Epub 2014 Sep 18.

Extracellular vesicles from neural stem cells transfer IFN-γ via Ifngr1 to activate Stat1 signaling in target cells

Affiliations

Extracellular vesicles from neural stem cells transfer IFN-γ via Ifngr1 to activate Stat1 signaling in target cells

Chiara Cossetti et al. Mol Cell. .

Erratum in

  • Mol Cell. 2014 Nov 20;56(4):609

Abstract

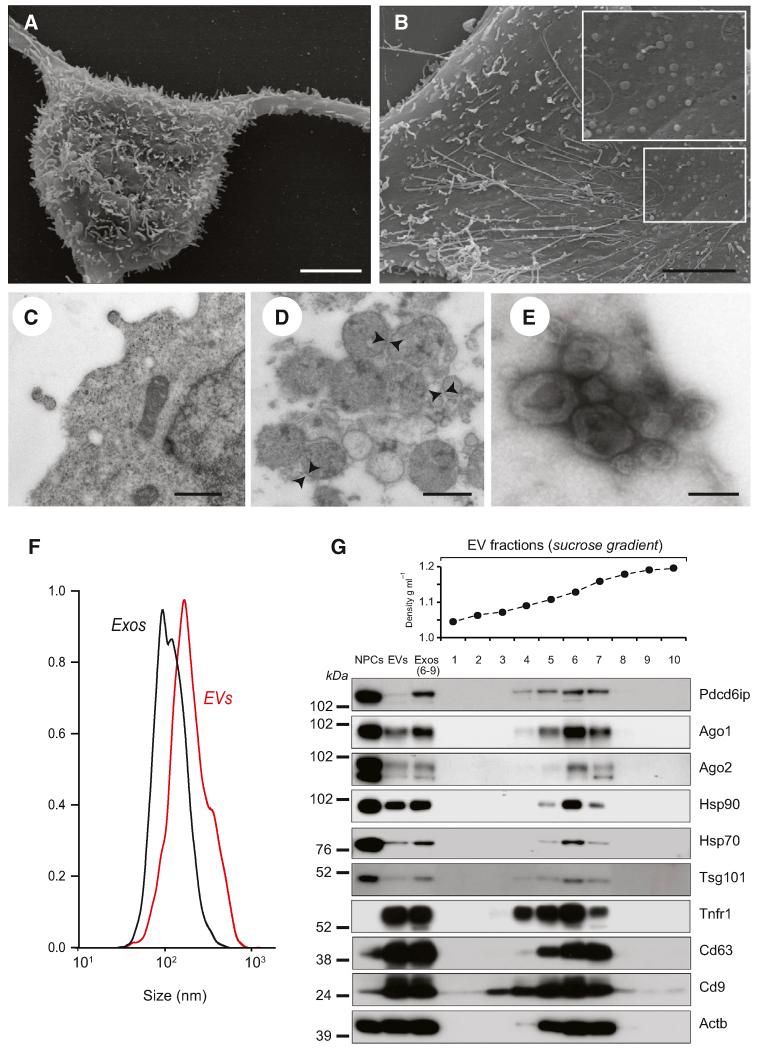
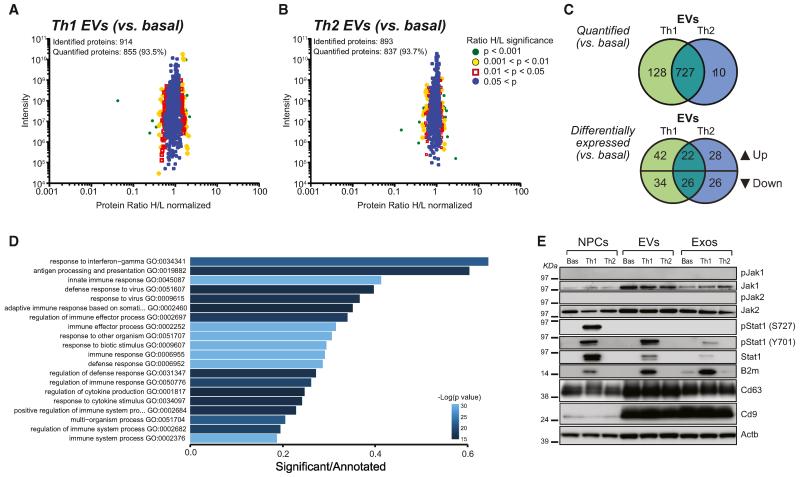
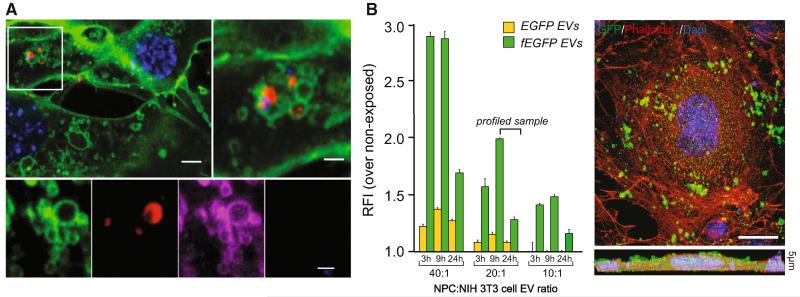
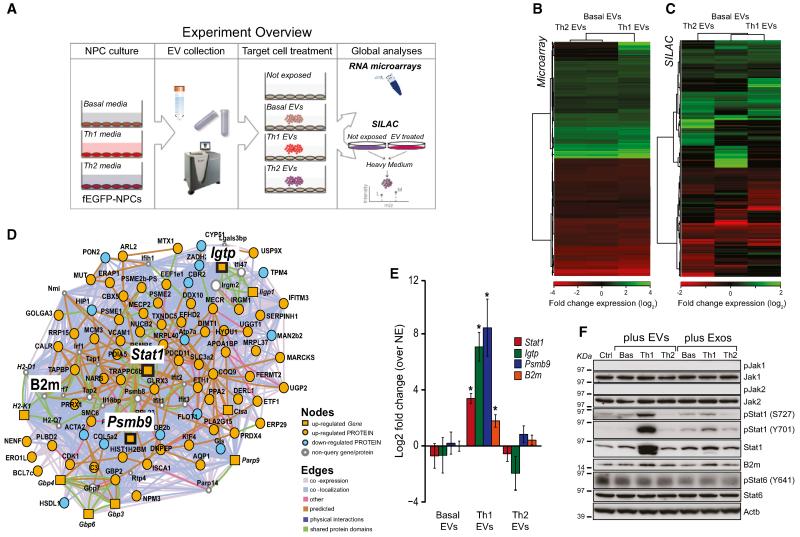
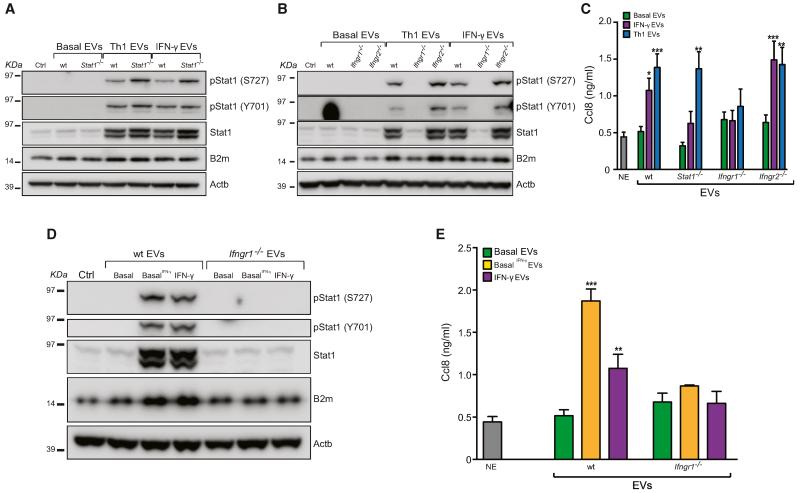
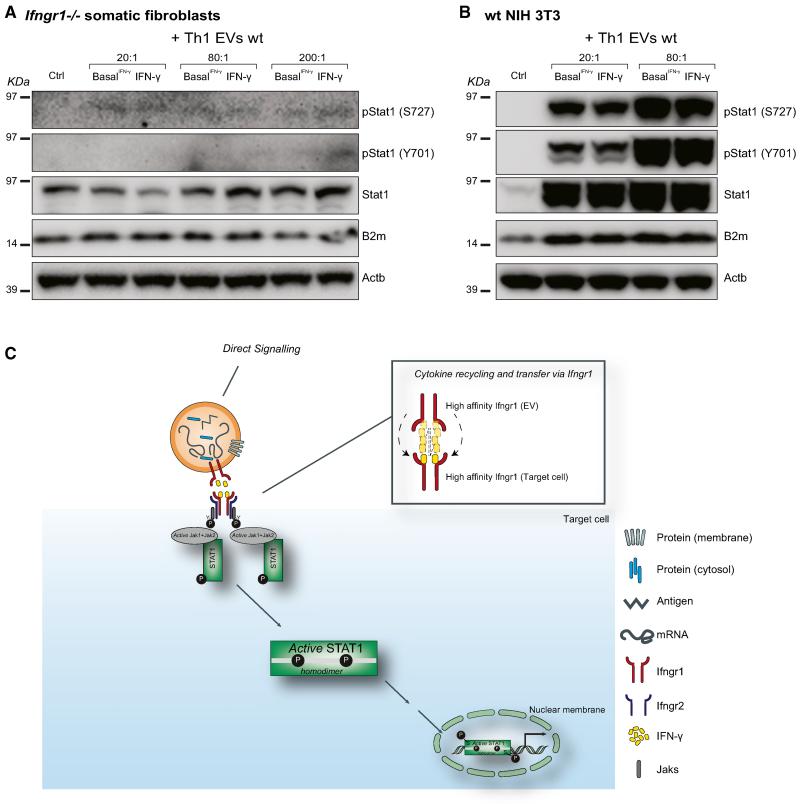
The idea that stem cell therapies work only via cell replacement is challenged by the observation of consistent intercellular molecule exchange between the graft and the host. Here we defined a mechanism of cellular signaling by which neural stem/precursor cells (NPCs) communicate with the microenvironment via extracellular vesicles (EVs), and we elucidated its molecular signature and function. We observed cytokine-regulated pathways that sort proteins and mRNAs into EVs. We described induction of interferon gamma (IFN-γ) pathway in NPCs exposed to proinflammatory cytokines that is mirrored in EVs. We showed that IFN-γ bound to EVs through Ifngr1 activates Stat1 in target cells. Finally, we demonstrated that endogenous Stat1 and Ifngr1 in target cells are indispensable to sustain the activation of Stat1 signaling by EV-associated IFN-γ/Ifngr1 complexes. Our study identifies a mechanism of cellular signaling regulated by EV-associated IFN-γ/Ifngr1 complexes, which grafted stem cells may use to communicate with the host immune system.


Figures

Figure 1
Figure 1. NPCs Secrete EVs
(A) Scanning electron microscopy (SEM) of a NPC with long adherent expansions, and numerous membrane protrusions on the surface. Scale bars, 5 μm. (B) SEM of the NPC surface, where membranous nanotubes and circular membrane vesicles are observed (magnified in the inset). Scale bars, 5 μm. (C) Magnified TEM detail of a NPC secreting two small-sized vesicles. Scale bars, 500 nm. (D) TEM of NPC EVs. EVs appear as heterogeneous population of differently sized vesicles (range 40–200 nm in diameter) surrounded by a double-layer membrane (arrowheads). Scale bars, 500 nm. (E) TEM of negative stained EVs, showing cup-shaped vesicles (80–120 nm). Scale bars, 100 nm. (F) Particle-size distribution of EVs (red line) and Exos (black line) obtained by NTA. Data are represented as mean ± SEM from n = 5 independent replicates and are normalized to 1 for size comparison. (G) Western blot of exosomal markers in NPCs, EVs, and Exos. Exos correspond to pooled fractions 6–9, having a density between 1.13 and 1.20 g/ml. This panel is representative of n = 3 independent protein preparations showing the same trends. See also Figure S1.
Figure 2
Figure 2. Th1 Cytokine Signaling Upregulates the IFN-γ Pathway in NPCs that Is Exported to EVs
(A–C) SILAC quantification of proteins expressed in Th1 and Th2 EVs. Scatter plots of the identified and quantified proteins in EVs Th1 (A) and Th2 (B) together with a color-coded quantitation significance as provided by MaxQuant software. Protein ratios are plotted against summed peptides intensities. (C) Venn diagrams of the numerical values for the indicated common and unique proteins quantified and differentially expressed in Th1 (green) and Th2 (blue) EVs versus basal EVs. p ≤ 0.05. (D) Bar chart showing the score of the top 20 most enriched GO terms in Th1 NPCs versus basal from RNA-seq data. Color coding indicates the adjusted p value. (E) Western blot of the Jak/Stat pathway in NPCs, EVs, and Exos. β-actin (Actb) was used as a loading control. This panel is representative of n = 4 independent protein preparations showing the same trends. See also Figures S2–S4 and Tables S1 and S2.
Figure 3
Figure 3. EVs Rapidly Adhere to and Are Incorporated into Target Cells via Plasma Membrane
(A) CD63-RFP EV uptake in fEGFP target cells (in green) as early as 2 hr after transfer. EVs are in red under confocal and magenta under super-resolution STED microscopy. Scale bars: top left, 5 μm; top right, 2 μm; bottom, 1 μm. (B) FCM analysis of EGFP internalization by target cells treated with increasing quantities of EVs. Data are represented as mean relative fluorescence intensity ± SEM from n = 3 independent experiments. A representative confocal image of a NIH 3T3 cell (red) exposed to fEGFP EVs (green) is shown. The lower panel is a Z stack of n = 5 optical slices taken at 1 μm intervals. Scale bar, 10 μm. Nuclei in (A) and (B) were stained with DAPI (blue). See also Movie S1.
Figure 4
Figure 4. Th1 EVs Activate Signal Transduction along the Stat1 Pathway in Target Cells at Gene and Protein Levels
(A) Experiment overview of whole transcriptome and proteome analyses in target cells exposed to NPC EVs. (B) Heatmap of the relative fold changes of genes in target cells exposed to 20:1 NPC:NIH 3T3 ratios of basal, Th1, or Th2 EVs for 24 hr in vitro. (C) Heatmap of the relative fold changes of proteins in target cells treated as in (B). (D) Integrated GeneMANIA network of differentially expressed Th1-specific genes and proteins identified using microarray and SILAC, respectively, by comparing target cells exposed to Th1 EVs versus basal EVs. (E) qPCR analysis of Stat1, Igtp, Psmb9, and B2M expression in target cells treated as in (B). Data are represented as mean log2 fold change ± SEM over target cells not exposed (NE) to EVs from a total of n = 3 independent experiments. *p < 0.05, compared to NE. (F) Western blot of the Jak/Stat pathway in target cells treated as in (B). This panel is representative of n = 4 independent protein preparations showing the same trends. β-actin (Actb) was used as a loading control. See also Table S3.
Figure 5
Figure 5. The IFN-γ/Ifngr1 Complex via EVs Activates Signal Transduction along the Stat1 Pathway in Target Cells
(A and B) Western blot of the Stat1 pathway in target cells treated with WT, Stat1−/− (A) and Ifngr1−/− and Ifngr2−/− (B) EVs as in Figure 4F. These panels are representative of n = 3 independent protein preparations showing the same trends. (C) Ccl8 release by target cells exposed to EVs as in (A) and (B), as measured by ELISA. (D) Western blot of the Stat1 pathway in target cells exposed to basal EVs pretreated with 100 ng/ml IFN-γ (basal IFN-γ; same concentration used for NPCs). This panel is representative of n = 3 independent protein preparations showing the same trends. (E) Ccl8 release by target cells exposed to EVs as in (D), as measured by ELISA. Data in (C) and (E) are represented as mean ± SEM from a total of n ≤ 3 independent experiments. *p ≤ 0.01, **p ≤ 0.001, ***p ≤ 0.0001, compared to NE target cells not exposed (NE) to EVs. β-actin (Actb) was used as a loading control in (A), (B), and (D). See also Figures S5 and S6.
Figure 6
Figure 6. The EV-Associated IFN-γ/Ifngr1 Complex Requires Ifngr1 on Target Cells to Sustain the Activation of the Stat1 Pathway
(A and B) Western blot of the Stat1 pathway in Ifngr1−/− (A) or WT (B) target cells treated with different ratios (range 30–300 μg EV protein/treatment) of WT IFN-γ-induced and basal IFN-γ EVs for 24 hr in vitro. Panels are representative of n = 3 independent protein preparations showing the same trends. β-actin (Actb) was used as a loading control. (C) Proposed model of recycling of soluble (free) IFN-γ by EV-associated Ifngr1 and retargeting to Ifngr1-expressing target cells.

References

    1. Al-Nedawi K, Meehan B, Micallef J, Lhotak V, May L, Guha A, Rak J. Intercellular transfer of the oncogenic receptor EGFRvIII by microvesicles derived from tumour cells. Nat. Cell Biol. 2008;10:619–624. - PubMed
    1. Antonyak MA, Li B, Boroughs LK, Johnson JL, Druso JE, Bryant KL, Holowka DA, Cerione RA. Cancer cell-derived microvesicles induce transformation by transferring tissue transglutaminase and fibronectin to recipient cells. Proc. Natl. Acad. Sci. USA. 2011;108:4852–4857. - PMC - PubMed
    1. Balaj L, Lessard R, Dai L, Cho YJ, Pomeroy SL, Breakefield XO, Skog J. Tumour microvesicles contain retrotransposon elements and amplified oncogene sequences. Nat Commun. 2011;2:180. - PMC - PubMed
    1. Breakefield XO, Frederickson RM, Simpson RJ. Gesicles: Microvesicle “cookies” for transient information transfer between cells. Mol. Ther. 2011;19:1574–1576. - PMC - PubMed
    1. Broderick L, Hoffman HM. cASCading specks. Nat. Immunol. 2014;15:698–700. - PubMed

Publication types

MeSH terms

Associated data