. 2014 Nov;17(11):1543-51.
doi: 10.1038/nn.3823. Epub 2014 Sep 21.

Single rodent mesohabenular axons release glutamate and GABA

Affiliations

Single rodent mesohabenular axons release glutamate and GABA

David H Root et al. Nat Neurosci. 2014 Nov.

Abstract

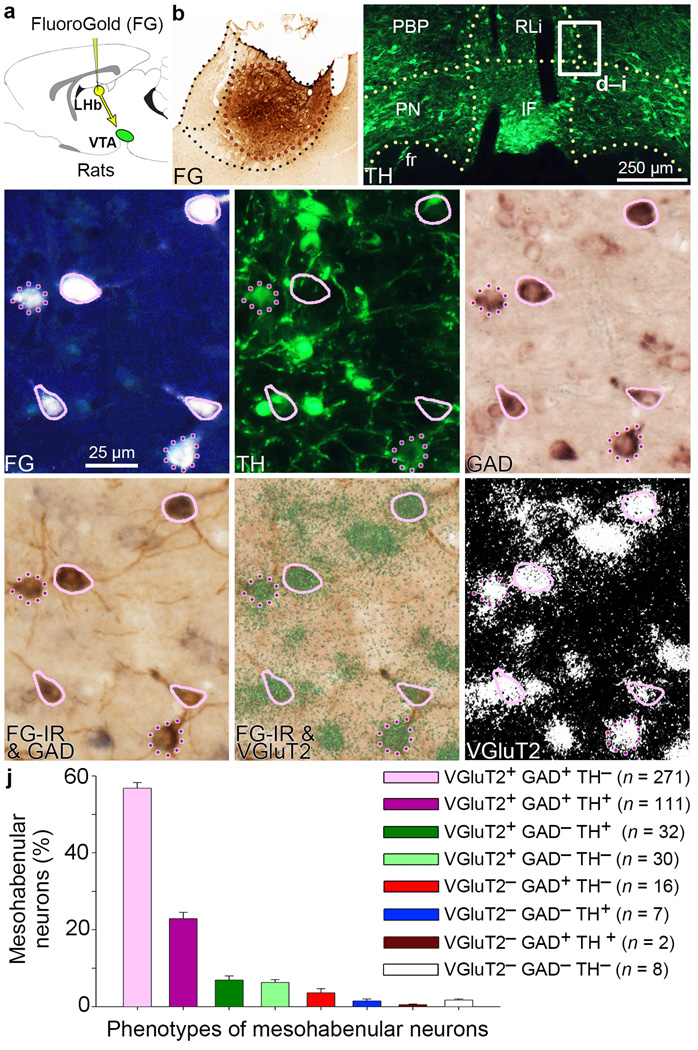
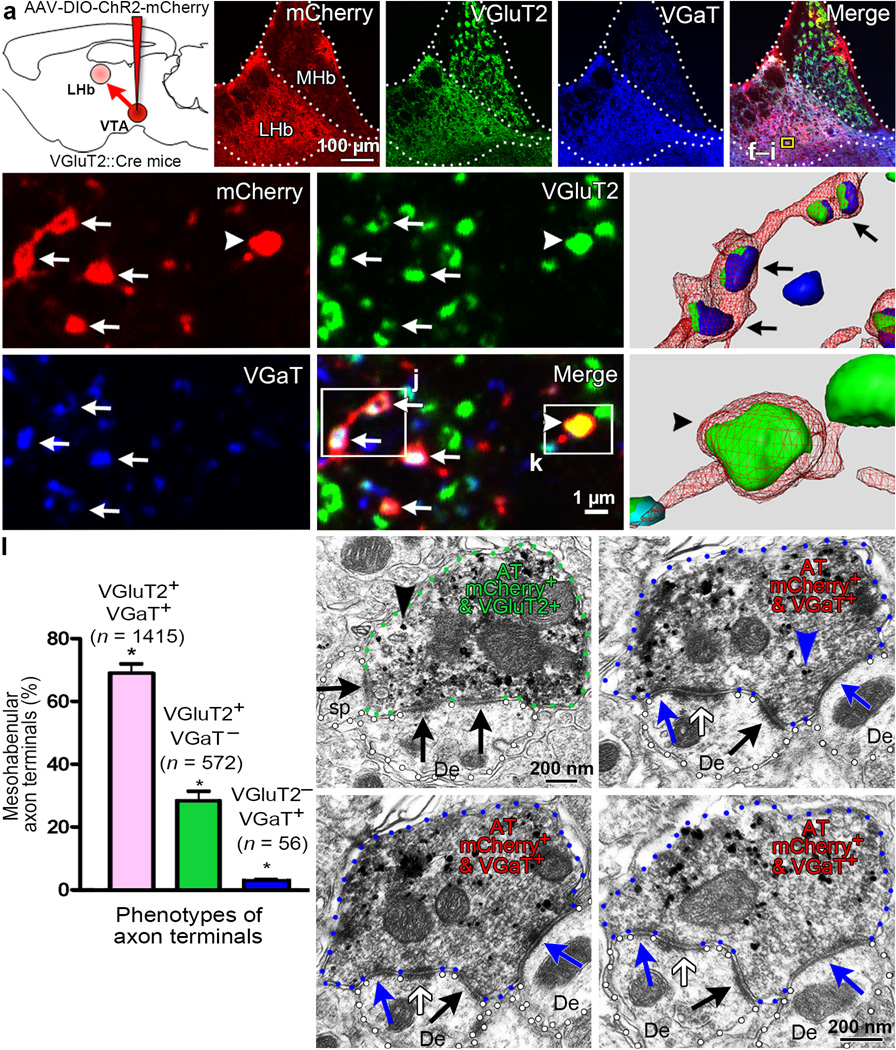
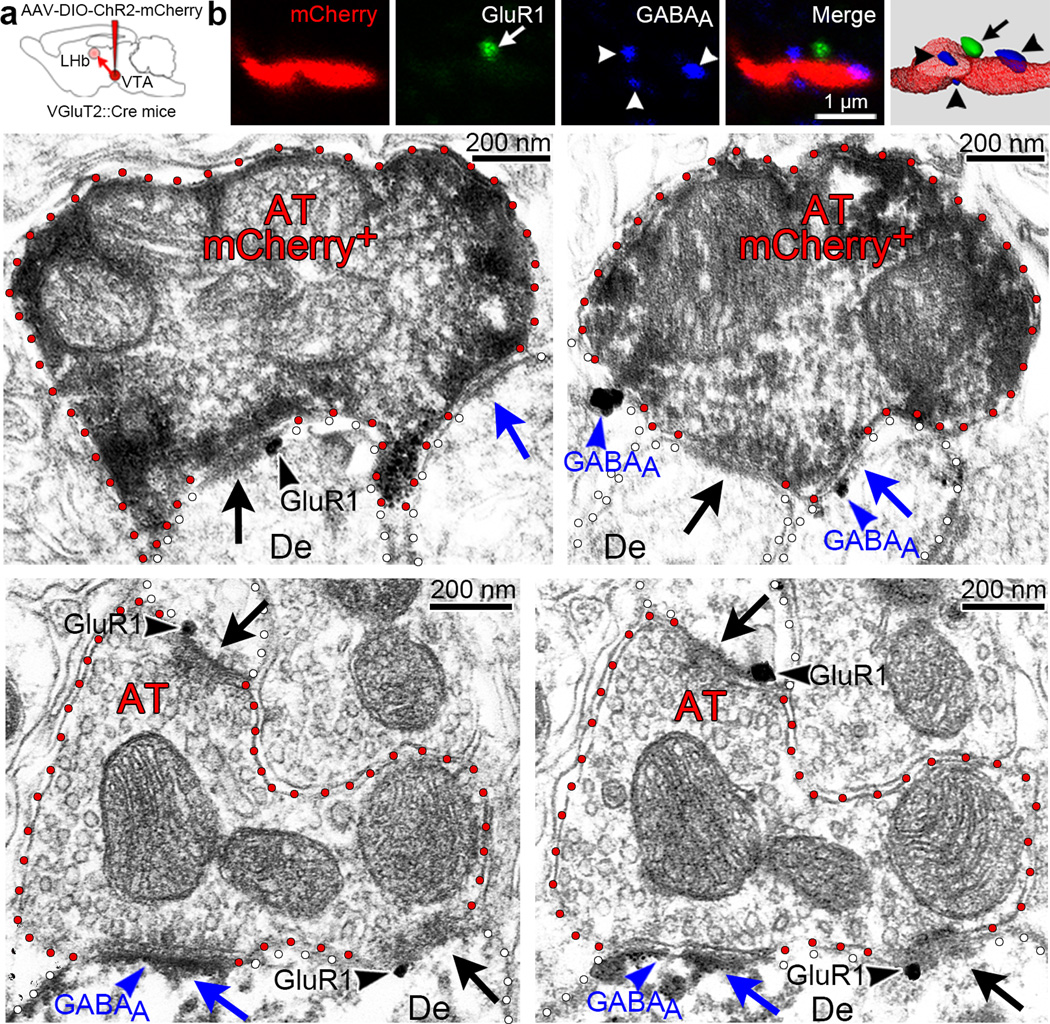
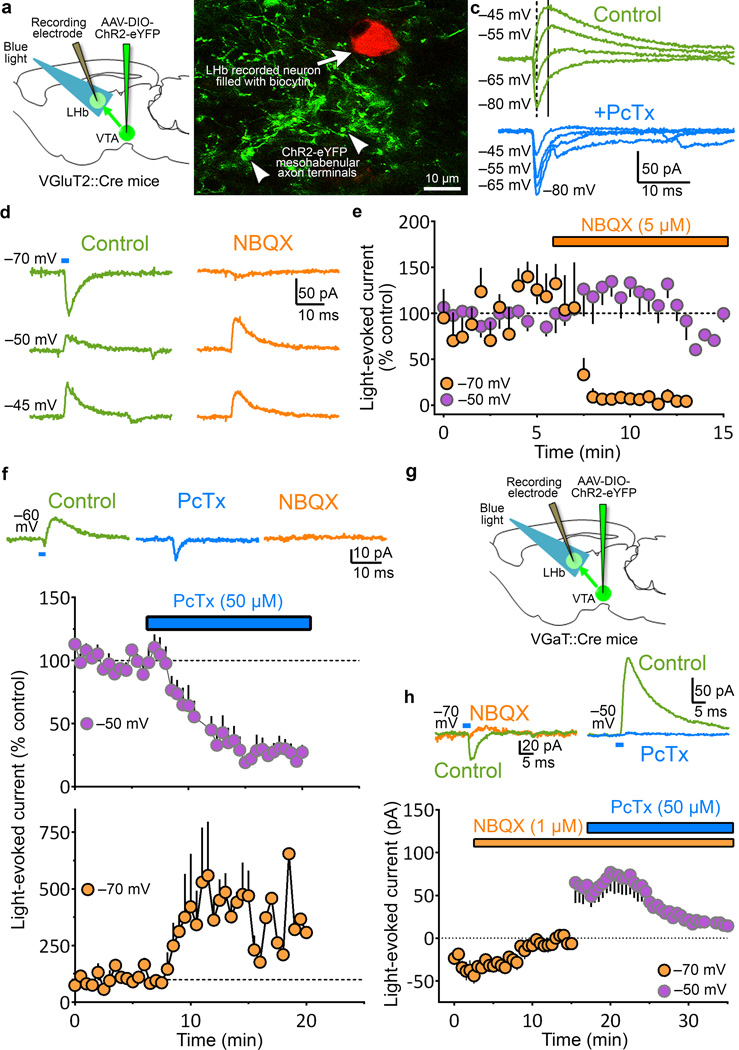
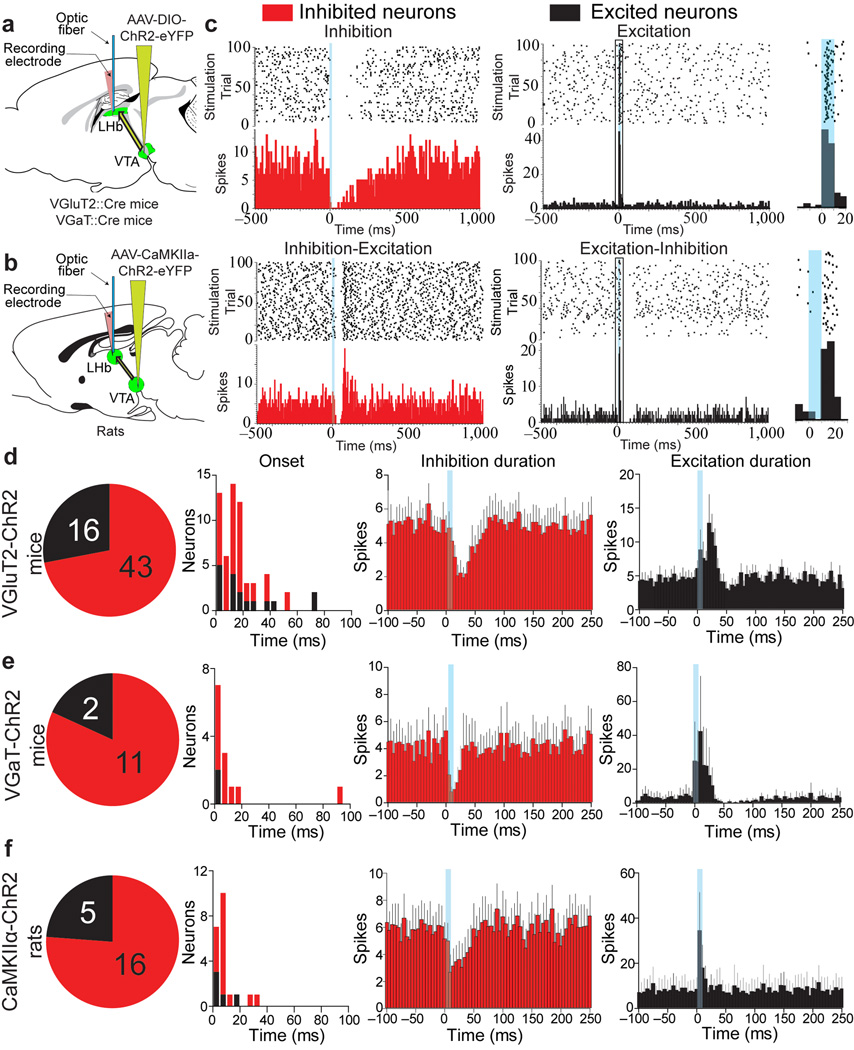
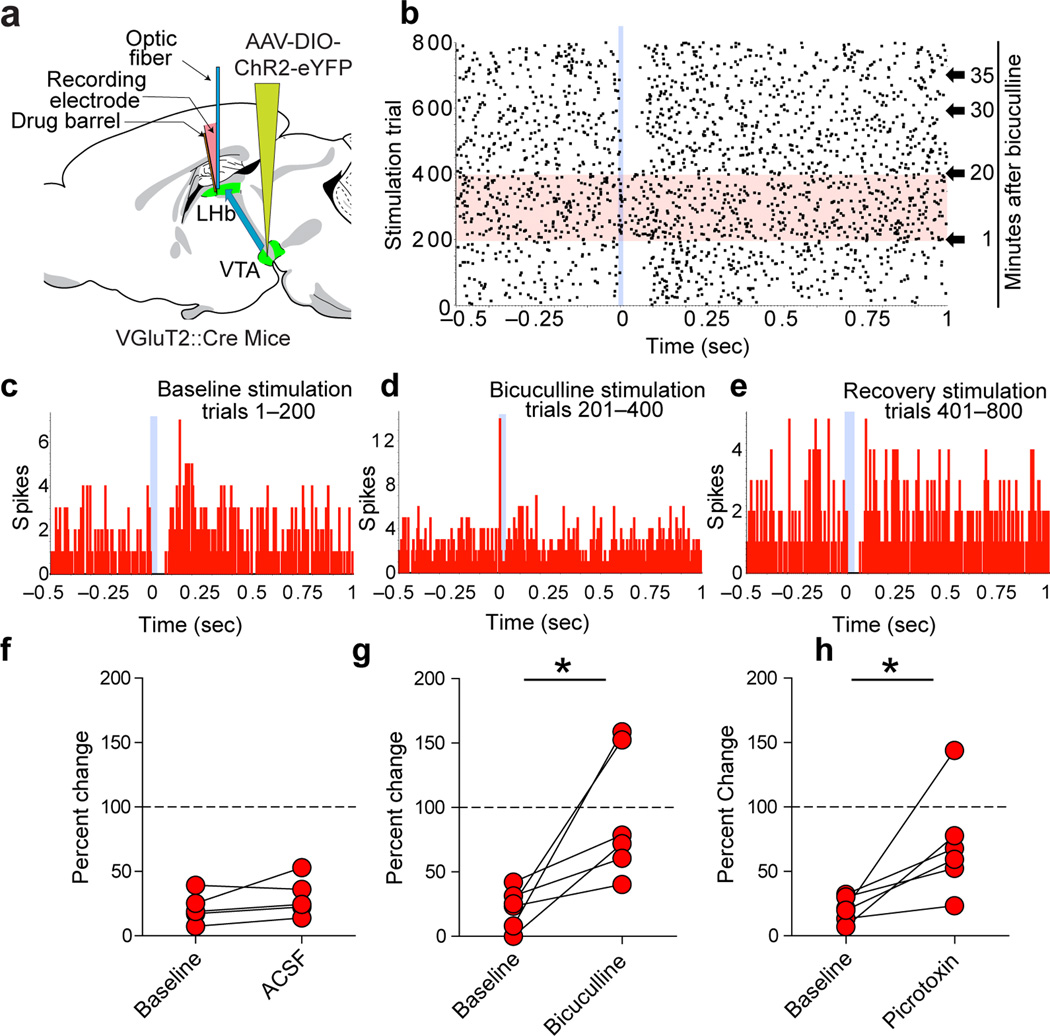
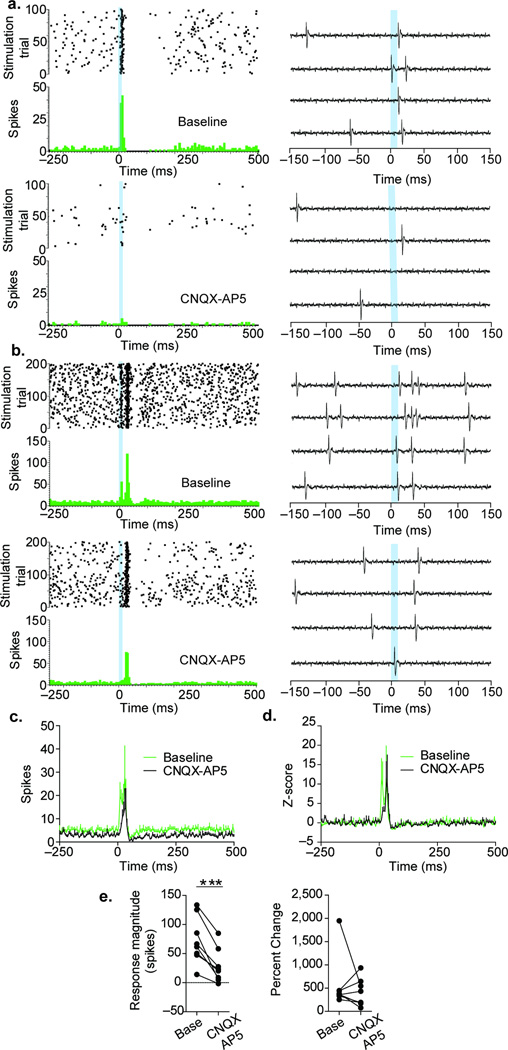
The lateral habenula (LHb) is involved in reward, aversion, addiction and depression through descending interactions with several brain structures, including the ventral tegmental area (VTA). The VTA provides reciprocal inputs to LHb, but their actions are unclear. Here we show that the majority of rat and mouse VTA neurons innervating LHb coexpress markers for both glutamate signaling (vesicular glutamate transporter 2; VGluT2) and GABA signaling (glutamic acid decarboxylase; GAD, and vesicular GABA transporter; VGaT). A single axon from these mesohabenular neurons coexpresses VGluT2 protein and VGaT protein and, surprisingly, establishes symmetric and asymmetric synapses on LHb neurons. In LHb slices, light activation of mesohabenular fibers expressing channelrhodopsin2 driven by VGluT2 (Slc17a6) or VGaT (Slc32a1) promoters elicits release of both glutamate and GABA onto single LHb neurons. In vivo light activation of mesohabenular terminals inhibits or excites LHb neurons. Our findings reveal an unanticipated type of VTA neuron that cotransmits glutamate and GABA and provides the majority of mesohabenular inputs.


Conflict of interest statement

The authors declare that they do not have any conflicts of interest (financial or otherwise) related to the data presented in this manuscript.

Figures

Figure 1
Figure 1. Most VTA neurons projecting to LHb co-express VGluT2 and GAD
(a,b) Delivery of the retrograde tracer FG into LHb. (c) FG-labeled VTA neurons were examined (TH; green). (d–i) Higher magnification of boxed area in c. FG is seen as white (d) or brown after its immunodetection (FG-IR; g; h). FG-labeled VTA neurons expressing TH (green cells; e), GAD65/67 mRNAs (purple cells; f) or VGluT2 mRNA (green-grain-aggregates, h or white-grains-aggregates, i). Most FG neurons co-expressed VGluT2 and GAD without TH (solid pink), fewer co-expressed TH (dotted purple). (j) Frequency of FG phenotypes (mean ± s.e.m.); 9–10 VTA sections each from three rats. RLi, rostral linear nucleus; IF, interfascicular nucleus; PN, paranigral nucleus; PBP, parabrachial pigmentosis nucleus; fr, fasciculus retroflexus.
Figure 2
Figure 2. Most mesohabenular axon terminals (AT) co-express VGluT2 and VGaT from which a single terminal simultaneously establishes symmetric and asymmetric synapses
(a) Cre-inducible AAV-DIO-ChR2-mCherry vector injected into VTA of VGluT2::Cre mice. Mesohabenular AT were identified by mCherry expression and examined under confocal (b–k) or electron microscopy (m–p). (b) LHb, not medial habenula (MHb), was densely innervated by VTA-fibers (mCherry). Single focal planes showing immunolabeling for VGluT2 (c, green), VGaT (d, blue), and merge (e). (f–i) Higher magnification of e boxed area; arrows indicate mCherry AT (f) co-expressing VGluT2 (g) and VGaT (h), and arrowheads indicate single VGluT2. (i) Merge. (j,k) 3-D reconstruction from boxed areas in i. (l) Frequency of AT-phenotypes (mean ± s.e.m.); 2043 mCherry AT were analyzed by 3-D reconstruction (12 LHb samples; 3 mice). Most AT co-expressed VGluT2 and VGaT, fewer had only VGluT2 or VGaT alone; significant AT phenotype effect by Friedman’s test; X2(2) = 24; p=0.000024; Dunn’s multiple comparison test (VGluT2+VGaT+ versus VGluT2+VGaT rank sum difference = 12, p=0.0429; VGluT2+VGaT+ versus VGluT2VGaT+ rank sum difference =24, p < 0.0001; VGluT2+VGaT versus VGluT2+VGaT rank sum difference = 12, p=0.0429; *p < 0.05). (m–p) Sequential LHb sections from VGluT2-ChR2-mCherry mouse showing mCherry detection by immunoperoxidase-labeling (scattered dark material) and either VGluT2 (black arrowhead; m) or VGaT (blue arrowhead; n) detection by immunogold. Experiments were repeated successfully three times. (m) A mCherry-VGluT2 AT establishing asymmetric synapses (black arrows) with a dendrite (De) and dendritic spine (sp). (n–p) Serial sections of a mCherry-VGaT AT establishing with a De an asymmetric synapse (black arrow), a symmetric synapse (blue arrows) and a puncta adhaerentia (white arrow).
Figure 3
Figure 3. Presence of both glutamatergic and GABAergic receptors postsynaptic to single mesohabenular axon terminals
a, Cre-inducible AAV-DIO-ChR2-mCherry vector injected into VTA of VGluT2::Cre mice. Mesohabenular AT were identified by mCherry expression and examined under confocal (b) or electron microscopy (c–f). (b) Mesohabenular fiber expressing mCherry (red). Single focal planes are shown for immunolabeling of glutamate receptor 1 containing AMPA receptor (GluR1, green), GABAA receptor (blue), and merge. Far right panel is 3-D reconstruction of merged z-stacks showing GluR1 (arrow) and GABAA receptors (arrowheads) proximal to a mCherry-labeled mesohabenular fiber. (c–d) LHb sections from VGluT2-ChR2-mCherry mouse showing mCherry detection by immunoperoxidase-labeling (scattered dark material) and detection of either GluR1 or GABAA receptor by immunogold. Experiments were repeated successfully three times. (c) Detection of GluR1(black arrowhead) at the asymmetric synapse (black arrow) postsynaptic to a mCherry-labeled AT that simultaneously forms a symmetric synapse (blue arrow). (d) Detection of GABAA receptor (blue arrowhead) at the symmetric synapse (blue arrow) postsynaptic to a mCherry-labeled AT that simultaneously forms an asymmetric synapse (black arrow). Experiments were repeated successfully three times. (e–f) Rat LHb serial sections. Detection of GluR1receptor by immunogold and detection of GABAA receptor by immunoperoxidase (scattered dark material). Detection of GluR1 (black arrowheads) at two asymmetric synapses (black arrows) postsynaptic to a mCherry-labeled AT that simultaneously forms a symmetric synapse containing GABAA receptor (blue arrowhead). Note the dendrite (De) establishing both symmetric and asymmetric synapses co-expressing GluR1 and GABAA receptors.
Figure 4
Figure 4. Selective stimulation of mesohabenular terminals evokes both GABAA mediated outward and AMPA mediated inward currents in LHb neurons
(a) Cre-inducible AAV-DIO-ChR2-eYFP vector injected into VTA of VGluT2::Cre mice. Light stimulation of ChR2-eYFP-fibers and LHb whole-cell recordings. (b) Recorded biocytin-filled LHb neuron intermingled with ChR2-eYFP-fibers. (c) Light pulses (473 nm; 5 ms) evoked inward and outward currents at varying holding potentials. Top: Light evoked both fast inward (dotted line) and slower outward currents (solid line). Light-evoked inward currents at hyperpolarized holding potentials (≈−70 mV), outward currents at depolarized holding potentials (≈−50 mV), and both inward and outward currents at intermediate holding potentials (≈−60 mV). Outward, but not inward, currents were blocked by Picrotoxin (PcTx, 50 µM; GABAA receptor antagonist). (d) Inward currents were glutamatergic. Inward currents were abolished by AMPA receptor antagonist NBQX (5 µM) at −70 mV [e, summary; mean ± s.e.m. orange circles; paired t-test, t(3)=4.1; p = 0.026, n = 4 neurons from 4 VGluT2-ChR2 mice], but not at −50 mV (middle) or −45 mV (bottom). (e) Summary responses at −50 mV; purple circles, paired t-test, t(4)=0.64, p = 0.56, n = 5 neurons from 5 VGluT2-ChR2 mice. (f) GABAergic outward currents shunt glutamatergic inward currents. Top: both, light-evoked small inward and larger outward currents (left) in cells at −60 mV. PcTx eliminated the outward current and enhanced the inward (middle), which was eliminated by NBQX (right). Bottom: PcTx eliminated outward currents in all cells held at −50 mV [mean ± s.e.m.; purple circles; paired t-test, t(9)=6.2; p = 0.0002, n = 10 neurons from 8 VGluT2-ChR2 mice]. PcTx enhanced inward currents in cells held at −70 mV [mean ± s.e.m; orange circles; paired t-test, t(4)=2.9; p = 0.0437, n = 5 neurons from 5 VGluT2-ChR2 mice]. (g) Confirmation of glutamatergic-GABAergic co-transmission by mesohabenular AT, Cre-inducible AAV-DIO-ChR2-eYFP vector injected into VTA of VGaT::Cre mice. (h) Top left: Light-evoked inward current (control) at −70 mV was abolished by NBQX (1 µM) [summary in bottom; mean ± s.e.m. orange circles; paired t-test, t(5)=3.4; p = 0.0189, n = 6 neurons from 3 VGaT-ChR2 mice]. Top right: Outward current at −50 mV in the same cell before (control) and after PcTx [summary in bottom; mean ± s.e.m. purple circles; paired t-test, t(5)=3.0; p = 0.03, n = 6 neurons from 3 VGaT-ChR2 mice].
Figure 5
Figure 5. In vivo optical stimulation of mesohabenular inputs evokes inhibition in most LHb neurons and evokes excitation in some
(a) Cre-inducible AAV-DIO-ChR2-eYFP vector injected into VTA of VGluT2::Cre (VGluT2-ChR2 mice) or VGaT::Cre mice (VGaT-ChR2 mice). (b) AAV-CaMKIIα-ChR2-eYFP vector injected into VTA of rats (CaMKIIα-ChR2 rats). (c–f) LHb single-unit recordings and local optical stimulation (10 ms pulse; blue bars). (c) Four responses were found: a fast inhibition followed by slow return to pre-stimulation activity (inhibition), a fast inhibition followed by excitation (inhibition-excitation), a fast brief excitation (excitation) or a fast brief excitation followed by inhibition (excitation-inhibition). Top panel shows rasters of timing of action potentials (black dots) for all optical stimulation sweeps and peristimulus time histograms (red or black bar graphs, bottom panels) aligned to optical stimulation onset. Insert (right) shows outlined portion of excited neurons’ latency and jitter spike times in response to light stimulation. (d–f). Summary of light-evoked LHb responses (duration panels show mean ± s.e.m.) from VGluT2-ChR2 mice (n = 59 neurons from 16 mice; d), VGaT-ChR2 mice (13 neurons from 5 mice; e), and CaMKIIα-ChR2 rats (21 neurons from 9 rats; f).
Figure 6
Figure 6. Mesohabenular light-evoked inhibition is sensitive to GABAA antagonists in vivo
(a) Delivery of a Cre-inducible AAV-DIO-ChR2-eYFP vector into the VTA of VGluT2::Cre mice. An optical fiber and a drug barrel [filled with a GABAA antagonist, either picrotoxin (0.5 mM) or bicuculline (0.5 mM)] were glued to a glass electrode. Light pulses (473 nm; 10 ms) were delivered every 2 sec. (b–e) Inhibition of a LHb neuron in response to 10 ms mesohabenular fiber light stimulation (sweeps 1–200, raster in b, peristimulus time histogram (PSTH) in c). Local infusion of bicuculline (50 nl) blocked mesohabenular light-evoked inhibition (sweeps 201–400, raster in b, PSTH in d). The inhibition was recovered 20 min after application of bicuculline (sweeps 401–800, raster in b, PSTH in e). (f–h) Population analysis of mesohabenular light-evoked inhibition. f, Percent change in firing rate evoked by mesohabenular fibers light stimulation before (baseline) and after artificial cerebral spinal fluid (ACSF). ACSF had no effect on light-evoked inhibition (paired t-test, t(4) = 1.62, p = 0.18, n = 5 neurons from 3 mice). (g) Percent change in firing rate evoked by mesohabenular fiber light stimulation before (baseline) and within 20 min of local infusion of bicuculline. Bicuculline significantly attenuated mesohabenular light-evoked inhibition (paired t-test, t(5)=3.2, p = 0.024, n = 6 neurons from 3 mice). (h) Percent change in firing rate evoked by mesohabenular fiber light stimulation before (baseline) and within 20 min of local infusion of picrotoxin. Picrotoxin significantly attenuated mesohabenular light-evoked inhibition (paired t-test, t(6)=3.0, p = 0.03, n = 7 neurons from 6 mice). *p < 0.05.
Figure 7
Figure 7. Mesohabenular light-evoked excitation is sensitive to glutamate receptor antagonists in vivo
(a–b) Two examples of mesohabenular light-evoked excitation. Top and bottom panels show LHb neurons before and immediately after local infusion of a cocktail of the AMPA and NMDA receptor antagonists CNQX (50 µM) and AP5 (100 µM). Examples of raw signals recorded are shown on the right side panels. CNQX-AP5 blocked the mesohabenular-evoked excitation in neuron shown in a. The excitation occurring immediately after the laser stimulation in neuron shown in b was blocked by CNQX-AP5, a secondary delayed excitation remained. (c–e) Population analysis of mesohabenular light-evoked excitation. (c) Changes in absolute spiking activity of LHb neurons. CNQX-AP5 decreased both spontaneous and mesohabenular light-evoked excitation. (d) After normalizing the firing activity of LHb neurons by their pre-stimulus spontaneous activity, two components of mesohabenular light-evoked excitation were evident: a fast component sensitive to CNQX-AP5 and a delayed component insensitive to CNQX-AP5. (e) Quantitative analysis of the mesohabenular light-evoked excitation. All LHb neurons showed a decrease in the number of spikes evoked by stimulation of mesohabenular fibers (paired t-test, t(6) = 5.8, p = 0.0007, left panel; n = 7 neurons from 4 VGluT2-ChR2 mice). In five neurons, CNQX-AP5 produced a larger decrease in mesohabenular light-evoked excitation relative to their spontaneous activity. In three neurons, CNQX-AP5 produced a decrease in the spontaneous activity that was larger than those observed on the mesohabenular light-evoked excitation, resulting in an increase in the percent change (right panel). ***p < 0.001.

Comment in

References

    1. Matsumoto M, Hikosaka O. Lateral habenula as a source of negative reward signals in dopamine neurons. Nature. 2007;447(7148):1111–1115. - PubMed
    1. Friedman A, et al. Electrical stimulation of the lateral habenula produces enduring inhibitory effect on cocaine seeking behavior. Neuropharmacology. 2010;59(6):452–459. - PMC - PubMed
    1. Bromberg-Martin ES, et al. Distinct tonic and phasic anticipatory activity in lateral habenula and dopamine neurons. Neuron. 2010a;67(1):144–155. - PMC - PubMed
    1. Bromberg-Martin ES, Matsumoto M, Hong S, Hikosaka O. A pallidus-habenula-dopamine pathway signals inferred stimulus values. J Neurophysiol. 2010b;104(2):1068–1076. - PMC - PubMed
    1. Li B, et al. Synaptic potentiation onto habenula neurons in the learned helplessness model of depression. Nature. 2011;470(7335):535–539. - PMC - PubMed

Publication types

Substances

LinkOut - more resources