. 2014 Sep 25;8(6):2031-2043.
doi: 10.1016/j.celrep.2014.08.038. Epub 2014 Sep 18.

Transcription factor networks in Drosophila melanogaster

Affiliations

Transcription factor networks in Drosophila melanogaster

David Y Rhee et al. Cell Rep. .

Abstract

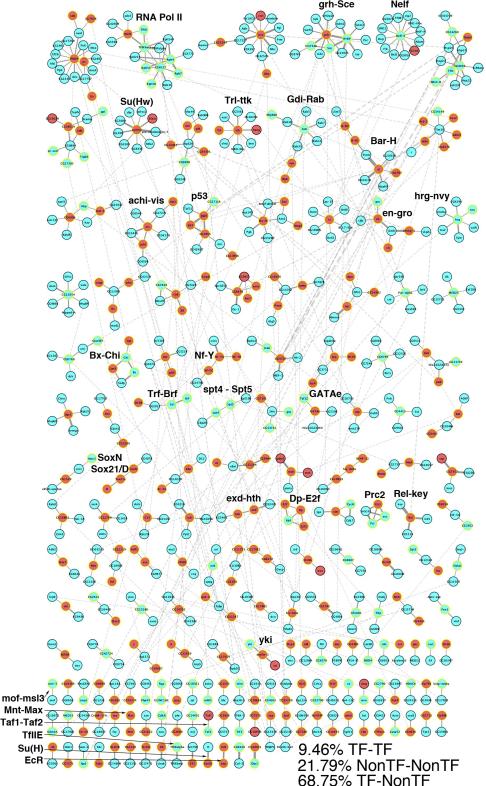
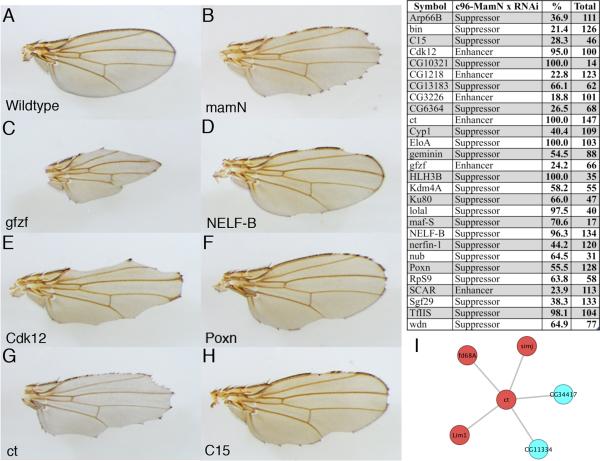
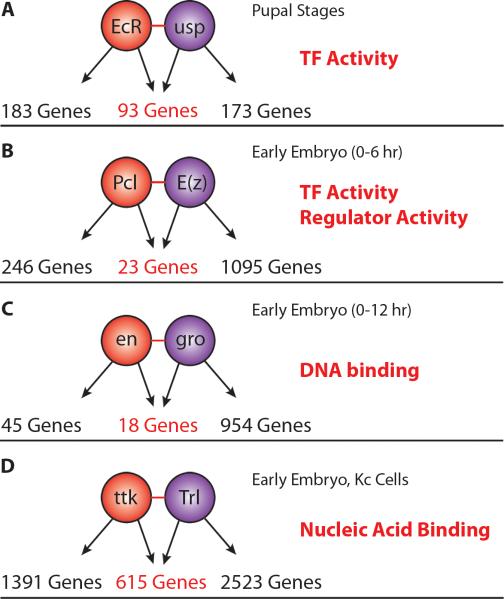
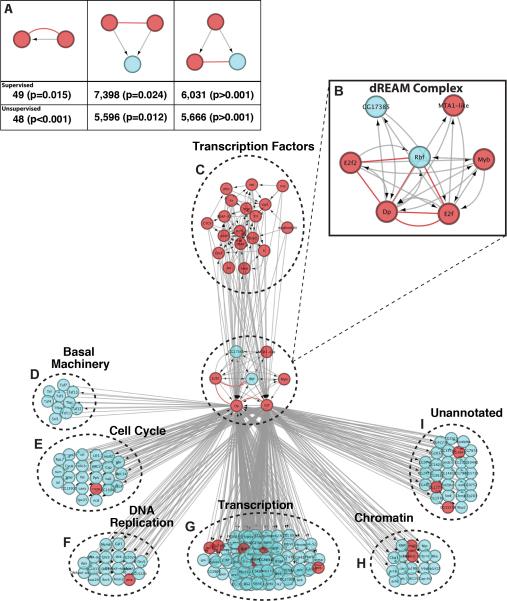
Specific cellular fates and functions depend on differential gene expression, which occurs primarily at the transcriptional level and is controlled by complex regulatory networks of transcription factors (TFs). TFs act through combinatorial interactions with other TFs, cofactors, and chromatin-remodeling proteins. Here, we define protein-protein interactions using a coaffinity purification/mass spectrometry method and study 459 Drosophila melanogaster transcription-related factors, representing approximately half of the established catalog of TFs. We probe this network in vivo, demonstrating functional interactions for many interacting proteins, and test the predictive value of our data set. Building on these analyses, we combine regulatory network inference models with physical interactions to define an integrated network that connects combinatorial TF protein interactions to the transcriptional regulatory network of the cell. We use this integrated network as a tool to connect the functional network of genetic modifiers related to mastermind, a transcriptional cofactor of the Notch pathway.


Figures

Figure 1
Figure 1. Drosophila Transcription Factor Interaction Network
High-confidence interaction network map representing interactions involving 229 site-specific transcription factors (Red nodes). The network contains 647 proteins connected by 624 edges. 117 putative protein complexes were defined using MCL clustering (Enright et al., 2002) (Table S3). 9.46% of interactions are binary TF-TF interactions, 21.79% are nonTF-nonTF interactions, and 68.75% are interactions between a TF and a nonTF protein. Protein interactions are shown as grey lines, with line thickness proportional to the HGScore for the interaction and inter-complex interactions shown in light grey. A number of previously characterized protein complexes have been labelled.
Figure 2
Figure 2. TF Protein complexes
Interactions identified in our TF study are marked in red, while blue edges represent interactions from the DroID database. (A) achintya and vismay protein complex. Previously identified interactions between achi, vis and CG15445 are recovered. Novel interactions with CG34179, CG6568, CG6540 and CG17272 represent targets for functional studies. (B) Su(Hw) protein complex. Known interactions with Cp190 and mod(mdg)4 are recovered. An interaction between CG8436 and Cp190 connects a novel interactor to the known Su(Hw) protein complex.
Figure 3
Figure 3. mastermind genetic screen
(A) Wild type fly wing (B) dominant negative mam (c96-mamN) phenotype (C, E, G) enhancer phenotypes seen with loss of gfzf, Cdk12 and ct. (D, F, H) suppressor phenotypes seen with loss of NELF-B, Poxn, and C15. Note the presence of patches of wild type wing margin. (I) Interactions between previously identified mam modifiers and the Notch target gene, ct. Red nodes represent transcription factors.
Figure 4
Figure 4. Tissue Specific Protein Complexes
(A) Tissue specificity distribution for all proteins in the high-confidence interaction network scored using the tissue specificity score algorithm11. Low-specificity proteins are labelled in green, moderate specificity proteins are labelled in yellow and high-specificity proteins in blue. Distribution was fit to a trimodal distribution and bins were defined with cut-offs of 0.4781 and 1.1741. (B) Testis-specific protein complex. Rounded squares represent “core” network proteins, while blue circles represent “specific” proteins. CG8117 is an ortholog of a human testis-specific transcription elongation factor, also expressed specifically in the Drosophila testis. The other Polymerase II components are expressed broadly. (C) Larval CNS specific protein complex. Nerfin-1 is highly specific to the larval CNS. It interacts with two low-specificity proteins, the transcription factor sd and the transcription co-activator yki.
Figure 5
Figure 5. Combinatorial targets of interacting TFs
Shared physical targets of interacting TF pairs. Enriched gene ontology terms for shared targets are delineated in red. (A) ecdysone receptor (EcR) and ultraspiracle (usp) comprise the two parts of the complete Ecdysone receptor. They co-occupy 93 shared targets during pupal stages. (B) Polycomblike (Pcl) and Enhancer of zeste (E(z)), two members of the Pcl-PRC2 complex. (C) engrailed (en) and groucho (gro). (D) tramtrack (ttk) and Trithoraxlike (Trl), two BTB/POZ domain containing proteins.
Figure 6
Figure 6. Inferred Regulatory Edges for Transcriptional Complexes
(A) Transcriptional regulatory motifs, representing instances where an interacting protein regulates its binding partner (1:1), combinatorial regulation of a target by two interacting factors (2:1), and regulation of interacting proteins by a single factor (1:2). Red edges indicate protein-protein interactions while grey edges with arrows indicate directional regulatory edges. (B) The components of the Drosophila dREAM complex recovered in our interaction network. (C) Transcriptional regulators of Dp-E2f (D) Basal Transcription Machinery components (E) Cell Cycle Proteins (F) DNA Replication Related Proteins (G) Transcription (H) Chromatin Related (I) Unannotated targets of Dp/E2f.
Figure 7
Figure 7. Connecting the mastermind genetic network
(A) Unsupervised network view of 35 mastermind modifiers. (B) Supervised network view of 62 mastermind modifiers. All nodes in interaction network are previously identified mastermind modifiers. Red nodes represent TFs. Blue nodes represent non-TF proteins. Red edges represent protein-protein interactions. Gray edges with arrows represent directional regulatory edges. The red asterisk indicates interactions related to serpent (srp).

References

    1. Adryan B, Teichmann SA. FlyTF: a systematic review of site-specific transcription factors in the fruit fly Drosophila melanogaster. Bioinformatics. 2006;22:1532–3. - PubMed
    1. Adryan B, Teichmann SA. The developmental expression dynamics of Drosophila melanogaster transcription factors. Genome biology. 2010;11:R40. - PMC - PubMed
    1. Araujo SJ, Cela C, Llimargas M. Tramtrack regulates different morphogenetic events during Drosophila tracheal development. Development. 2007;134:3665–3676. - PubMed
    1. Artavanis-Tsakonas S, Rand MD, Lake RJ. Notch signalling: cell fate control and signal integration in development. Science. 1999;284:770–776. - PubMed
    1. Babu MM, Luscombe NM, Aravind L, Gerstein M, Teichmann SA. Structure and evolution of transcriptional regulatory networks. Curr Opin Struct Biol. 2004;14:283–91. - PubMed

Publication types

MeSH terms

LinkOut - more resources