. 2015 Feb:63:79-89.
doi: 10.1016/j.cortex.2014.07.007. Epub 2014 Aug 12.

Common molecular basis of the sentence comprehension network revealed by neurotransmitter receptor fingerprints

Affiliations

Common molecular basis of the sentence comprehension network revealed by neurotransmitter receptor fingerprints

Karl Zilles et al. Cortex. 2015 Feb.

Abstract

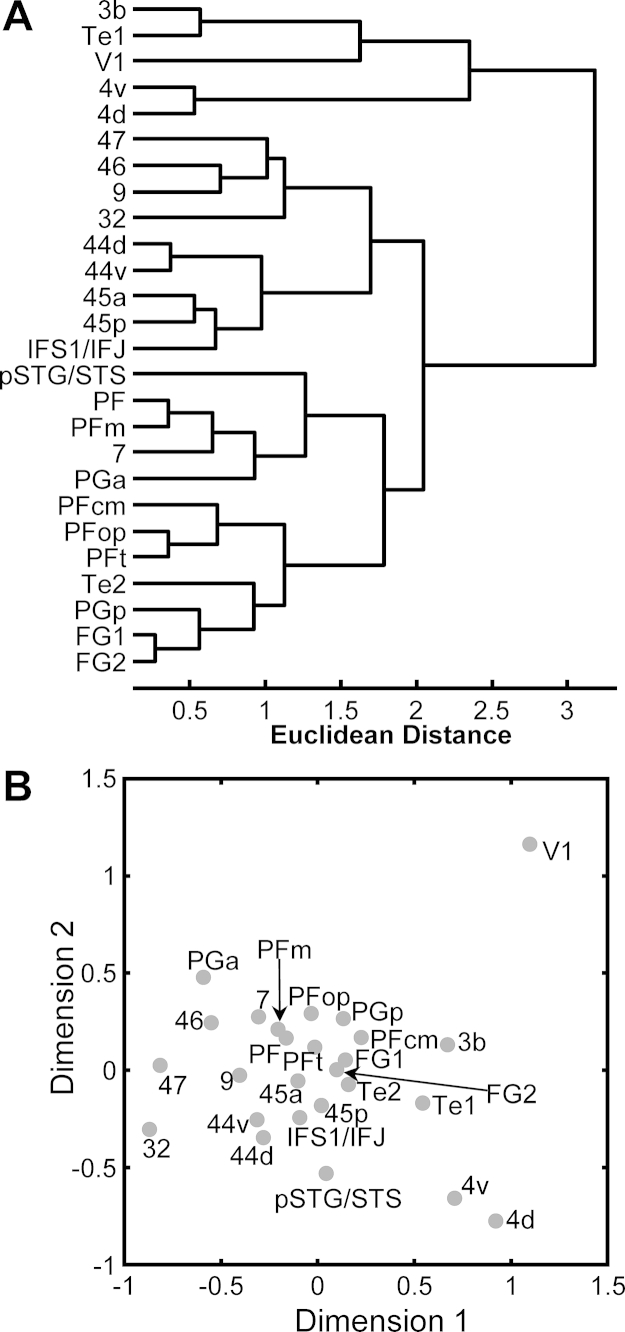
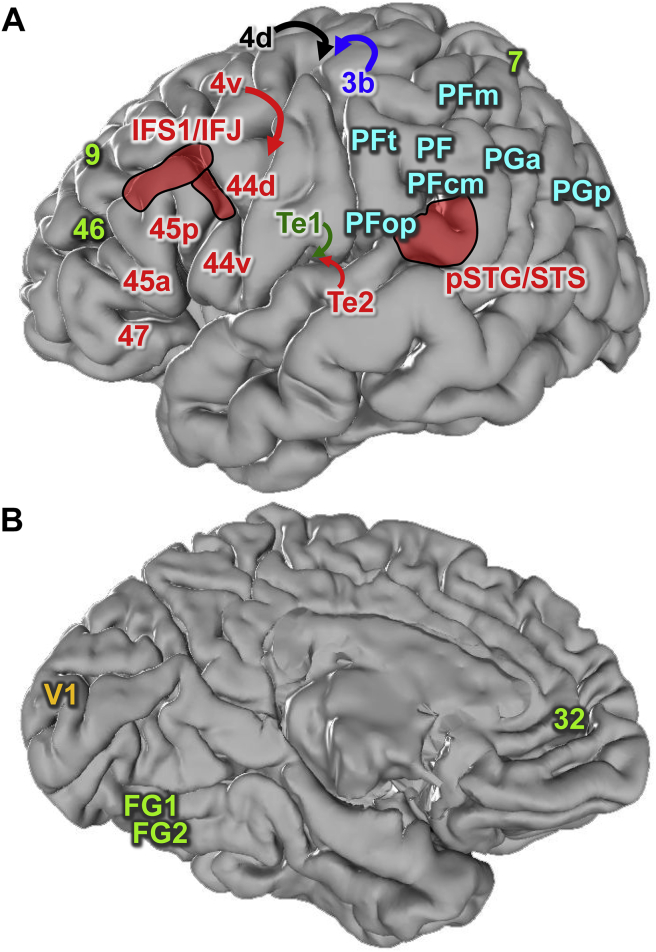
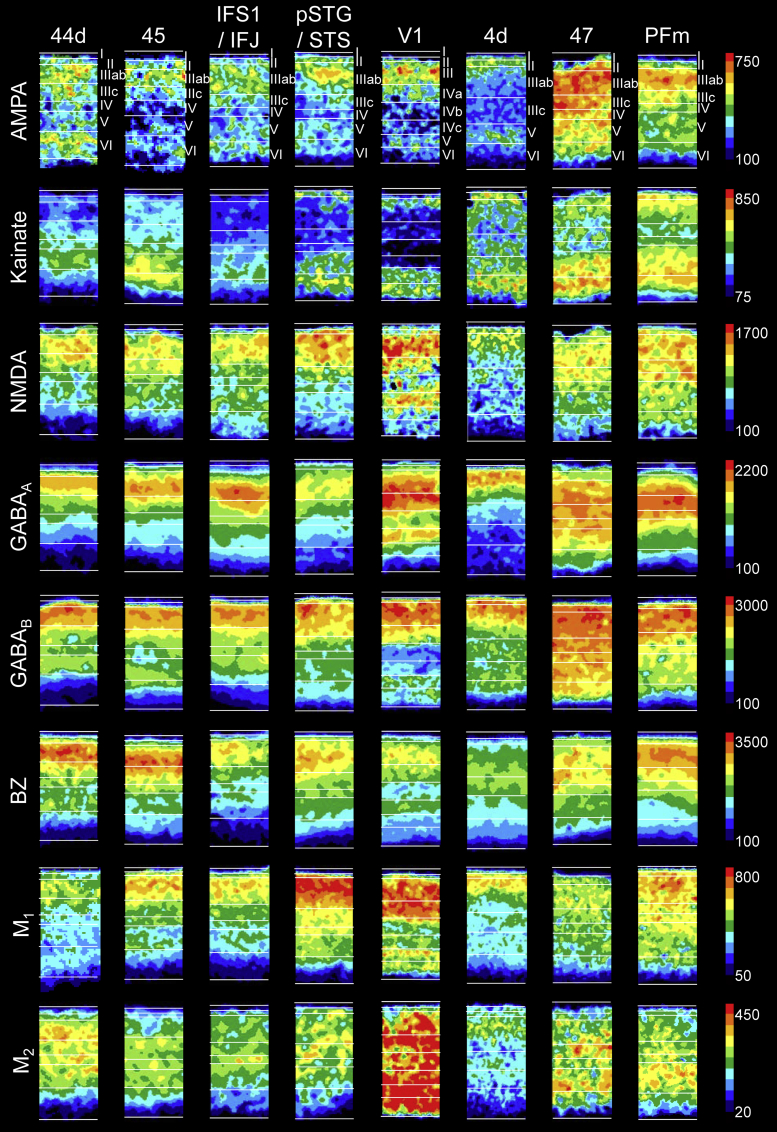
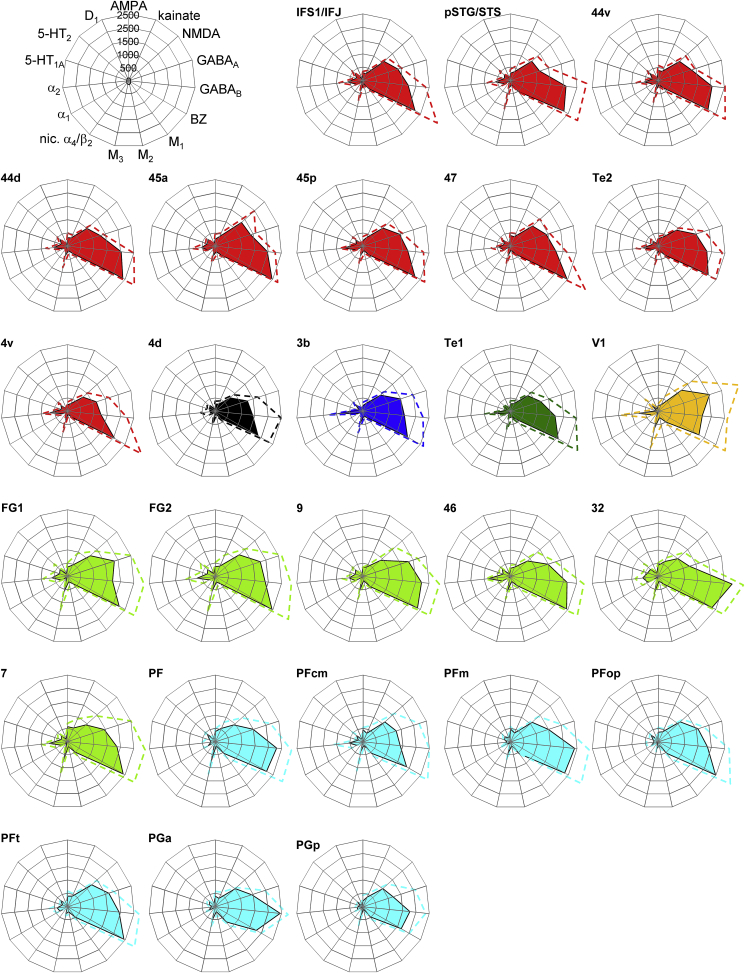
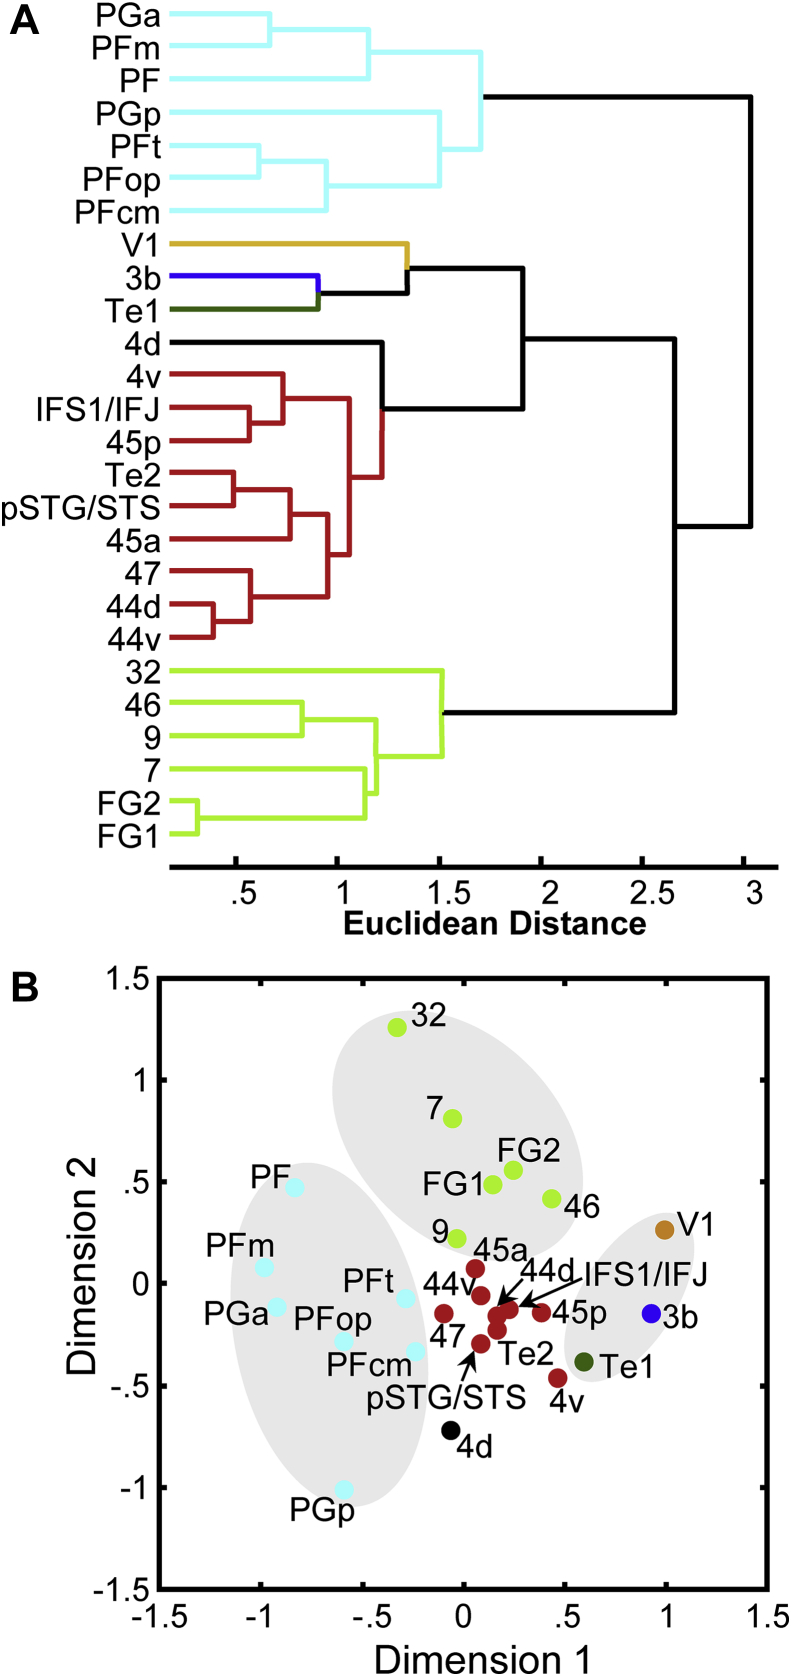
The language network is a well-defined large-scale neural network of anatomically and functionally interacting cortical areas. The successful language process requires the transmission of information between these areas. Since neurotransmitter receptors are key molecules of information processing, we hypothesized that cortical areas which are part of the same functional language network may show highly similar multireceptor expression pattern ("receptor fingerprint"), whereas those that are not part of this network should have different fingerprints. Here we demonstrate that the relation between the densities of 15 different excitatory, inhibitory and modulatory receptors in eight language-related areas are highly similar and differ considerably from those of 18 other brain regions not directly involved in language processing. Thus, the fingerprints of all cortical areas underlying a large-scale cognitive domain such as language is a characteristic, functionally relevant feature of this network and an important prerequisite for the underlying neuronal processes of language functions.

Keywords: Brain mapping; Human cerebral cortex; Language; Transmitter receptors.


Figures

Fig. S1
Fig. S1
Receptor fingerprints of the examined brain regions in the right hemisphere. Absolute densities (in fmol/mg protein) of 15 receptors shown as fingerprints of the examined brain regions. The positions of the different receptor types and the axis scaling are identical in all polar plots, and specified in the polar plot at the top left corner of the figure. The grey area represents the mean absolute receptor densities, SEM is given by the dashed lines.
Fig. S2
Fig. S2
Hierarchical cluster tree and multidimensional scaling of receptor fingerprints in 26 cortical brain regions of the right hemisphere. (A) Hierarchical cluster tree of receptor distribution patterns in the right hemisphere. (B) Multidimensional scaling resulting in a 2D display of the 15-dimensional receptor feature vectors of the receptor fingerprints of 26 cortical regions measured in the right hemisphere.
Fig. 1
Fig. 1
Localization of examined cortical regions. Localization of examined cortical regions projected on the lateral (A) and medial (B) surfaces of the single subject MNI template brain (Evans et al., 2012): 3b (primary somatosensory cortex, part of BA 3); 4 (primary motor cortex); 7 (BA 7); 9 (BA 9); 32 (BA 32); 44d (dorsal BA 44); 44v (ventral BA 44); 45a (anterior BA 45); 45p (posterior BA 45); 46 (BA 46); 47 (BA 47); FG1 and FG2 (cytoarchitectonically defined extrastriate visual areas on the fusiform gyrus); IFS1/IFJ (areas in the inferior frontal sulcus and at the junction between the inferior frontal and precentral sulci); PF, PFm, PFcm, PFop and PFt (areas located within BA40); PGa and PGp (areas located within BA 39); pSTG/STS (areas of the posterior superior temporal gyrus and sulcus); Te1 (primary auditory cortex, BA 41); Te2 (auditory belt area, BA 42); V1 (primary visual cortex, BA 17). BA: Brodmann areas (Brodmann, 1909). Red indicates language-related brain regions with similar fingerprints (see Fig. 4). Dark blue, dark green, yellow and black encode the primary somatosensory, auditory and visual cortices, and the hand representation region of the motor cortex, respectively. Light blue encodes IPL areas, whereas light green represents prefrontal, superior parietal, cingulate, and extrastriate fusiform areas.
Fig. 2
Fig. 2
Laminar distribution of receptors in selected cortical areas. Color coded receptor autoradiographs visualizing the laminar distribution of glutamate (AMPA, kainate, NMDA), GABA (GABAA, GABAB, GABAA associated benzodiazepine (BZ) binding sites), acetylcholine (M1, M2, M3, nicotinic α42), norepinephrine (α1, α2), serotonin (5-HT1A, 5-HT2) and dopamine (D1) receptors in 8 of the 26 examined brain areas. Color coding indicates receptor densities in fmol/mg protein.
Fig. 2
Fig. 2
Laminar distribution of receptors in selected cortical areas. Color coded receptor autoradiographs visualizing the laminar distribution of glutamate (AMPA, kainate, NMDA), GABA (GABAA, GABAB, GABAA associated benzodiazepine (BZ) binding sites), acetylcholine (M1, M2, M3, nicotinic α42), norepinephrine (α1, α2), serotonin (5-HT1A, 5-HT2) and dopamine (D1) receptors in 8 of the 26 examined brain areas. Color coding indicates receptor densities in fmol/mg protein.
Fig. 3
Fig. 3
Receptor fingerprints of the examined brain regions in the left hemisphere. Absolute densities (in fmol/mg protein) of 15 receptors shown as fingerprints of the 26 examined brain regions. The positions of the different receptor types and the axis scaling are identical in all polar plots, and specified in the polar plot at the top left corner of the figure. The colored area represents the mean absolute receptor densities; SEM is given by the dashed lines. Color coding as in Figs. 1, 4A and B.
Fig. 4
Fig. 4
Hierarchical cluster tree and multidimensional scaling of receptor fingerprints in 26 cortical brain regions. (A) Hierarchical cluster tree of receptor distribution patterns in the left hemisphere. (B) Multidimensional scaling resulting in a 2D display of the 15-dimensional receptor feature vectors of the receptor fingerprints of 26 cortical regions measured in the left hemisphere.

References

    1. Amunts K., Lenzen M., Friederici A.D., Schleicher A., Morosan P., Palomero-Gallagher N. Broca's region: novel organizational principles and multiple receptor mapping. PLoS Biology. 2010;8(9) - PMC - PubMed
    1. Amunts K., Malikovic A., Mohlberg H., Schormann T., Zilles K. Brodmann's areas 17 and 18 brought into stereotaxic space-where and how variable? NeuroImage. 2000;11(1):66–84. - PubMed
    1. Amunts K., Schleicher A., Bürgel U., Mohlberg H., Uylings H.B.M., Zilles K. Broca's region revisited: cytoarchitecture and intersubject variability. Journal of Comparative Neurology. 1999;412:319–341. - PubMed
    1. Brodmann K. 1909. Vergleichende Lokalisationslehre der Großhirnrinde in ihren Prinzipien dargestellt auf Grund des Zellbaues. (Leipzig: Barth)
    1. Caspers S., Schleicher A., Bacha-Trams M., Palomero-Gallagher N., Amunts K., Zilles K. Organization of the human inferior parietal lobule based on receptor architectonics. Cerebral Cortex. 2013;23:615–628. - PMC - PubMed

Publication types

Substances

LinkOut - more resources