

Biogeography of Paenibacillus larvae, the causative agent of American foulbrood, using a new multilocus sequence typing scheme
- PMID: 25244044
- PMCID: PMC4405054
- DOI: 10.1111/1462-2920.12625
Biogeography of Paenibacillus larvae, the causative agent of American foulbrood, using a new multilocus sequence typing scheme
Abstract
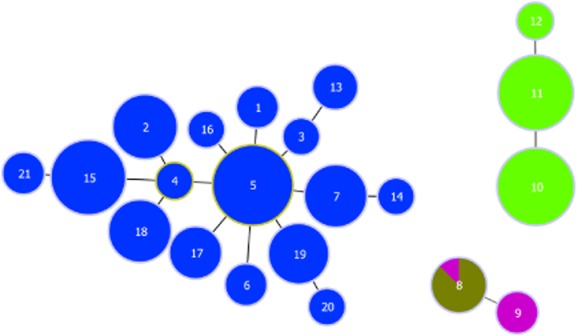
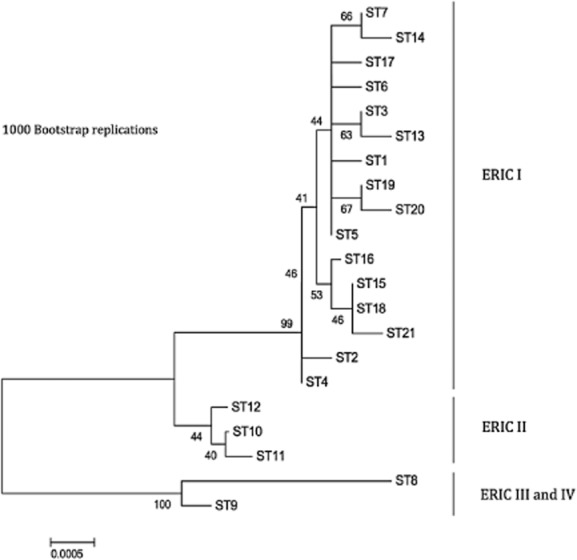
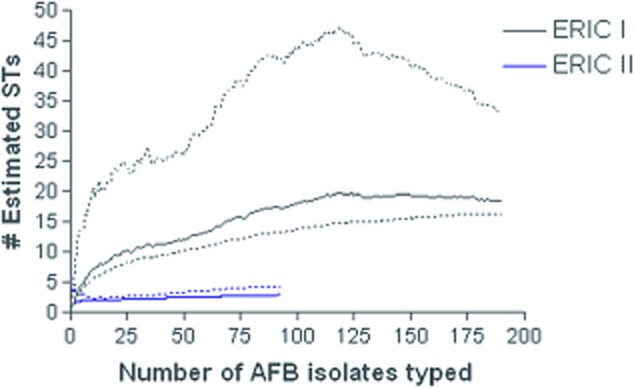
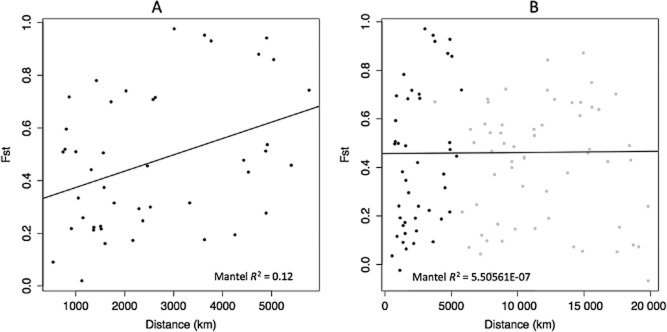
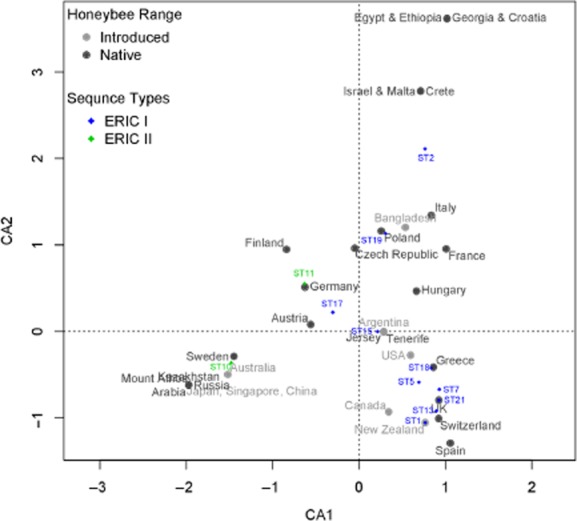
American foulbrood is the most destructive brood disease of honeybees (Apis mellifera) globally. The absence of a repeatable, universal typing scheme for the causative bacterium Paenibacillus larvae has restricted our understanding of disease epidemiology. We have created the first multilocus sequence typing scheme (MLST) for P. larvae, which largely confirms the previous enterobacterial repetitive intergenic consensus (ERIC)-polymerase chain reaction (PCR)-based typing scheme's divisions while providing added resolution and improved repeatability. We have used the new scheme to determine the distribution and biogeography of 294 samples of P. larvae from across six continents. We found that of the two most epidemiologically important ERIC types, ERIC I was more diverse than ERIC II. Analysis of the fixation index (FST ) by distance suggested a significant relationship between genetic and geographic distance, suggesting that population structure exists in populations of P. larvae. Interestingly, this effect was only observed within the native range of the host and was absent in areas where international trade has moved honeybees and their disease. Correspondence analysis demonstrated similar sequence type (ST) distributions between native and non-native countries and that ERIC I and II STs mainly have differing distributions. The new typing scheme facilitates epidemiological study of this costly disease of a key pollinator.
© 2014 The Authors. Environmental Microbiology published by Society for Applied Microbiology and John Wiley & Sons Ltd.
Figures
References
-
- Alippi AM, Aguilar OM. Characterization of isolates of Paenibacillus larvae subsp. larvae from diverse geographical origin by the polymerase chain reaction and BOX primers. J Invertebr Pathol. 1998;72:21–27. - PubMed
-
- Alippi AM, Reynaldi FJ, Lopez AC, De Giusti MR, Aguilar OM. Molecular epidemiology of Paenibacillus larvae larvae and incidence of American foulbrood in Argentinean honeys from Buenos Aires province. J Apic Res. 2004;43:135–143.
-
- Antúnez K, Piccini C, Castro-Sowinski S, Rosado AS, Seldin L, Zunino P. Phenotypic and genotypic characterization of Paenibacillus larvae isolates. Vet Microbiol. 2007;124:178–183. - PubMed
-
- Büchler R, Berg S, Le Conte Y. Breeding for resistance to Varroa destructor in Europe. Apidologie. 2010;41:393–408.
Publication types
MeSH terms
Grants and funding
LinkOut - more resources
Full Text Sources
Other Literature Sources
Molecular Biology Databases
Miscellaneous
