. 2014 Oct;124(10):4657-67.
doi: 10.1172/JCI74381. Epub 2014 Sep 17.

B7-H1-expressing antigen-presenting cells mediate polarization of protumorigenic Th22 subsets

B7-H1-expressing antigen-presenting cells mediate polarization of protumorigenic Th22 subsets

Dong-Ming Kuang et al. J Clin Invest. 2014 Oct.

Abstract

Classical IL-22-producing T helper cells (Th22 cells) mediate inflammatory responses independently of IFN-γ and IL-17; however, nonclassical Th22 cells have been recently identified and coexpress IFN-γ and/or IL-17 along with IL-22. Little is known about how classical and nonclassical Th22 subsets in human diseases are regulated. Here, we used samples of human blood, normal and peritumoral liver, and hepatocellular carcinoma (HCC) to delineate the phenotype, distribution, generation, and functional relevance of various Th22 subsets. Three nonclassical Th22 subsets constituted the majority of all Th22 cells in human liver and HCC tissues, although the classical Th22 subset was predominant in blood. Monocytes activated by TLR2 and TLR4 agonists served as the antigen-presenting cells (APCs) that most efficiently triggered the expansion of nonclassical Th22 subsets from memory T cells and classical Th22 subsets from naive T cells. Moreover, B7-H1-expressing monocytes skewed Th22 polarization away from IFN-γ and toward IL-17 through interaction with programmed death 1 (PD-1), an effect that can create favorable conditions for in vivo aggressive cancer growth and angiogenesis. Our results provide insight into the selective modulation of Th22 subsets and suggest that strategies to influence functional activities of inflammatory cells may benefit anticancer therapy.


Figures

Figure 6
Figure 6. Protumorigenic roles of IL-22 and IL-17 in HCC.
(A) Correlations between proportions of Th22 cells in tumor tissue from 26 patients and TNM or intrahepatic metastasis in patients. (B and C) Paraffin-embedded hepatoma samples were stained with an anti–IL-22 Ab. Scale bar: 50 μm. Based on the median value of IL-22+ cell density, patients were divided into low-density (n = 99) and high-density (n = 98) groups; cumulative OS and DFS times were calculated by the Kaplan-Meier method and analyzed by a log-rank test (C). (D and H) IL-22 plus IL-17 promoted the survival, proliferation, and proangiogenic activities of hepatoma cells. HepG2 cells undergoing serum starvation were stimulated with IL-22 alone or combined with IL-17 or IFN-γ (50 ng/ml for all) for 10 hours. Expression of the indicated proteins and genes (given as the mean) was determined by immunoblotting and real-time PCR, respectively. Results are representative of 4 separate experiments (n = 4–6). (E) Injection of T cells polarized by tumor monocytes significantly enhanced HepG2 hepatoma growth in mice; the effects were attenuated by additional injection of neutralizing Abs against IL-22 and IL-17. Data represent the mean ± SEM of 5 independent experiments (n = 6 for each). *P < 0.05, compared with the Medium group; #P < 0.05, compared with the T cell group (without B7-H1 mAb). (F and G) IL-22 plus IL-17 promoted the growth and angiogenesis of hepatoma in mice. Data represent the mean ± SEM (n = 5 for each group). *P < 0.05. Paraffin-embedded hepatoma samples were stained with an anti-CD34 Ab (G). Scale bar: 100 μm.
Figure 5
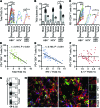
Figure 5. Repression of IFN-γ–producing Th22 subsets in human HCC.
(A) FACS analysis of IL-22 expression in fresh Th cells isolated from paired blood and peritumoral liver and tumor tissues. (B) FACS analysis of Th22 subset composition in Th cells isolated from paired blood and peritumoral liver and tumor tissues: classical Th22, white bar; Th22/Th1, dark gray bar; Th22/Th17, light gray bar; Th22/Th17/Th1, black bar. Data represent the mean ± SEM. (C) FACS analysis of PD-1 expression on Th cells isolated from paired blood and peritumoral liver and tumor tissues. (DF) Correlations between the levels of PD-1+ Th cells and the following cells isolated from samples of peritumoral liver and tumor tissues from HCC patients (n = 26): total Th22 cells (D), IFN-γ+ Th22 cells (E), and IL-17+ Th22 cells (F). (G) Expression of IL-22 and PD-1 in Th cells isolated from paired samples of blood and peritumoral liver and tumor tissues from 8 HCC patients. Numbers in quadrants indicate the percentage of cells in each quadrant. (H) Expression of IL-22, PD-1, and CD3 in HCC tumor tissue. One of 5 representative micrographs is shown. Scale bars: 40 μm. Cells analyzed in AC were isolated from samples collected from 20 patients with HBV-related HCC, 3 patients with HCV-related HCC, and 3 patients with HCC but no HBV or HCV infection. *P < 0.05; **P < 0.01; ***P < 0.001.
Figure 4
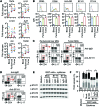
Figure 4. Monocyte B7-H1 regulates the balance between IFN-γ– and IL-17–related Th22 cells.
(A) Real-time PCR determination of relative fold changes in the indicated cytokine mRNAs in monocytes from paired samples of blood and peritumoral liver and tumor tissues from 11 HCC patients. (B) FACS analysis of expression of the indicated markers on monocytes from paired samples of blood and peritumoral liver and tumor tissues from 4 HCC patients. (C and D) Purified T cells were cultured for 8 days with autologous peritumoral liver or tumor monocytes (C) or LPS-stimulated peripheral monocytes (D) in the presence of an anti–B7-H1 or a control Ab, as described in Methods. Expression of IL-22 in Th cells and expression of IFN-γ and IL-17 in Th22 are shown. Numbers in quadrants indicate the percentage of cells in each quadrant. (E and F) T cells were left untreated or were cultured with mock, B7-H1, or B7-DC transfectant in the presence of IL-1β, IL-6, IL-23, and TGF-β for 9 days as described in Methods. In parallel, B7-H1–expressing transfectants were preincubated for 1 hour with an anti–B7-H1 or a control Ab. STAT activation on day 1 (E) and Th22 subset composition on day 8 (F) in T cells were determined by immunoblotting and FACS, respectively. Th22 subset composition is shown in F: classical Th22, white bar; Th22/Th1, dark gray bar; Th22/Th17, light gray bar; Th22/Th17/Th1, black bar. Data represent the mean ± SEM (B and F). Results represent 4 separate experiments (n = 4–6; CF). *P < 0.05; **P < 0.01.
Figure 3
Figure 3. Activated APCs induce Th22 subset expansion.
(A) Monocytes (MOs), Mϕ, and DCs were left untreated or stimulated with Pam3CysSK4, LPS, poly (I:C), or CpG oligodeoxynucleotides (ODNs) for 18 hours. Cytokine production was determined by ELISA. (BD) Monocytes, Mϕ, or DCs were left untreated or stimulated with LPS for 5 hours and then cultured for 8 days with autologous T cells, naive T cells, or memory T cells as described in Methods. Proliferation (Ki67) and expression of IFN-γ and IL-17 in Th22 cells were detected by FACS. Numbers in quadrants indicate the percentage of cells in each quadrant. (E) Blockade of TNF-α, IL-1β, IL-6, IL-23, and/or TGF-β changed the subset composition of Th22 cells expanded by LPS-stimulated monocytes. (F and G) T cells were left untreated or cultured with conditioned media from LPS- or Pam3CysSK4-stimulated monocytes, Mϕ, or DCs for 7 days (F) or for the indicated times (G), as described in Methods. Activation of STAT proteins was detected by immunoblotting. IL-4–treated T cells served as a positive control. (H) Inhibiting STAT1 and STAT3 activation changed the subset composition of Th22 cells expanded by LPS-stimulated monocytes. Th22 subset composition was determined by FACS. Th22 subset composition is shown in CE and H: classical Th22, white bar; Th22/Th1, dark gray bar; Th22/Th17, light gray bar; Th22/Th17/Th1, black bar. Data represent the mean ± SEM (A, CE, and H). Results in all panels represent 5 separate experiments (n = 5–7). *P < 0.05 and **P < 0.01, compared with untreated cells (A) or the indicated groups.
Figure 2
Figure 2. Phenotypic characteristics and transcription factor profiles of Th22 subsets.
FACS analysis was performed to determine the phenotypic characteristics of Th0 (IFN-γIL-17IL-22), Th1 (IFN-γ+IL-17IL-22), Th17 (IFN-γIL-17+IL-22), Th17/Th1 (IFN-γ+IL-17+IL-22), Th22 (IFN-γIL-17IL-22+), Th22/Th1 (IFN-γ+IL-17IL-22+), Th22/Th17 (IFN-γIL-17+IL-22+), and Th22/Th17/Th1 (IFN-γ+IL-17+IL-22+) subsets isolated from blood, peritumoral liver tissue, and tumor tissue of HCC patients. Data for each of the indicated markers represent at least 4 patients. Data shown are from 30 independent experiments.
Figure 1
Figure 1. Th22 subset composition in blood, liver, and HCC.
(A and B) FACS analysis of IL-22, IFN-γ, IL-4, and IL-17 expression in T cells from normal human blood (A) and in Th22 cells isolated from blood, normal/peritumoral liver tissue, and HCC tissue (B). (C) FACS analysis of IFN-γ and IL-17 expression in IL-4 Th22 cells from blood, normal/peritumoral liver tissue, and HCC tissue. Data shown in AC are from 30 independent experiments. Numbers adjacent to the outlined areas (A) or in quadrants (A and C) indicate the percentage of cells in each quadrant. Cells used in the analyses came from samples collected as follows: normal blood from 12 healthy individuals (AC); normal liver tissue from 4 liver hemangioma patients (B and C); paired blood, peritumoral liver tissue, and tumor tissue from 20 patients with HBV-related HCC, 3 patients with HCV-related HCC, and 3 patients with HCC but no HBV or HCV infection (B and C).

References

    1. Wolk K, Sabat R. Interleukin-22: a novel T- and NK-cell derived cytokine that regulates the biology of tissue cells. Cytokine Growth Factor Rev. 2006;17(5):367–380. doi: 10.1016/j.cytogfr.2006.09.001. - DOI - PubMed
    1. Sonnenberg GF, Fouser LA, Artis D. Border patrol: regulation of immunity, inflammation and tissue homeostasis at barrier surfaces by IL-22. Nat Immunol. 2011;12(5):383–390. doi: 10.1038/ni.2025. - DOI - PubMed
    1. Rubino SJ, Geddes K, Girardin SE. Innate IL-17 and IL-22 responses to enteric bacterial pathogens. Trends Immunol. 2012;33(3):112–118. doi: 10.1016/j.it.2012.01.003. - DOI - PubMed
    1. Kamanaka M, et al. Memory/effector (CD45RB(lo)) CD4 T cells are controlled directly by IL-10 and cause IL-22-dependent intestinal pathology. J Exp Med. 2011;208(5):1027–1040. doi: 10.1084/jem.20102149. - DOI - PMC - PubMed
    1. Qin WZ, et al. Expressions of IL-22 in circulating CD4+/CD8+ T cells and their correlation with disease activity in SLE patients. Clin Exp Med. 2011;11(4):245–250. doi: 10.1007/s10238-011-0134-9. - DOI - PubMed

Publication types

MeSH terms