. 2014 Sep 22;9(9):e107587.
doi: 10.1371/journal.pone.0107587. eCollection 2014.

Leukemic stem cell frequency: a strong biomarker for clinical outcome in acute myeloid leukemia

Affiliations

Leukemic stem cell frequency: a strong biomarker for clinical outcome in acute myeloid leukemia

Monique Terwijn et al. PLoS One. .

Abstract

Introduction: Treatment failure in acute myeloid leukemia is probably caused by the presence of leukemia initiating cells, also referred to as leukemic stem cells, at diagnosis and their persistence after therapy. Specific identification of leukemia stem cells and their discrimination from normal hematopoietic stem cells would greatly contribute to risk stratification and could predict possible relapses.

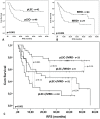
Results: For identification of leukemic stem cells, we developed flow cytometric methods using leukemic stem cell associated markers and newly-defined (light scatter) aberrancies. The nature of the putative leukemic stem cells and normal hematopoietic stem cells, present in the same patient's bone marrow, was demonstrated in eight patients by the presence or absence of molecular aberrancies and/or leukemic engraftment in NOD-SCID IL-2Rγ-/- mice. At diagnosis (n=88), the frequency of the thus defined neoplastic part of CD34+CD38- putative stem cell compartment had a strong prognostic impact, while the neoplastic parts of the CD34+CD38+ and CD34- putative stem cell compartments had no prognostic impact at all. After different courses of therapy, higher percentages of neoplastic CD34+CD38- cells in complete remission strongly correlated with shorter patient survival (n=91). Moreover, combining neoplastic CD34+CD38- frequencies with frequencies of minimal residual disease cells (n=91), which reflect the total neoplastic burden, revealed four patient groups with different survival.

Conclusion and perspective: Discrimination between putative leukemia stem cells and normal hematopoietic stem cells in this large-scale study allowed to demonstrate the clinical importance of putative CD34+CD38- leukemia stem cells in AML. Moreover, it offers new opportunities for the development of therapies directed against leukemia stem cells, that would spare normal hematopoietic stem cells, and, moreover, enables in vivo and ex vivo screening for potential efficacy and toxicity of new therapies.


Conflict of interest statement

Competing Interests: The authors have declared that no competing interests exist.

Figures

Figure 1
Figure 1. Gating strategy for the CD34+CD38- compartment and identification of pLSCs and HSCs in this compartment. I. Gating of CD34+CD38- AML cells.
Cells were labeled with antibody-fluorochrome combinations as described in Patients, Materials and Methods. Remaining erythrocytes, debris and dead cells are largely excluded in an FSC/SSC plot (A). CD45dim/SSCdim blast cells (B) were gated to homogeneity in FSC/SSC plot (C). CD34 positive cells are gated (D) and the CD38- stem cells are gated within this fraction (E). The CD38-negative fraction in D may contain two stem cell populations differing in CD34 expression (details in text). F. Within the CD34+CD38- gate, CD38 is plotted against an aberrant marker (in this case CD19) to indicate presence of putative LSCs (pLSCs) and HSCs. II. Identification of pLSCs and HSCs. This patient (nr 317) was diagnosed with t(8;21). Primary gating was as in I. Sorted CD34+CD38-/CD19+ cells (A, in red) were t(8;21) positive; sorted CD34+CD38-/CD19- cells (A, in green) were t(8;21) negative. These two populations were backgated in FSC/SSC (B,E), CD34/SSC (C,F) and CD45/SSC (D,G) plots. The CD19- cells are shown in the upper panels and the CD19+ cells in the lower panels. Dotted vertical lines (B–D) show that normal CD19- cells are FSClow (B), CD34low (C) and slightly lower in CD45 (D), compared to CD19+ cells (E–G). The dotted horizontal line shows that SSC of the normal stem cells (in green) was slightly lower than that of neoplastic stem cells (in red). FISH data are from an example published previously . Similar results were found in an additional series of 7 patients (Tables 1 and 2). FSC and SSC of CD19+ pLSC were factor 1.71 and 1.77 higher than lymphocyte present in the same samples. FSC and SSC of the CD19 negative cells were only 1.08 and 1.20 times lower than lymphocytes.
Figure 2
Figure 2. Marker-negative cells may contain leukemic cells defined by aberrant scatter. I. Gating/sorting strategy and molecular analysis for patient 456.
CD34+ CD38- cells (patient 456, figure 2) were gated as in figure 1. CD34+CD38- cells were either CD7-negative (green in A and C, 25% of CD34+CD38-) or CD7 positive (red in A and D, 75% of CD34+CD38-). CD7+ cells were FSC/SSChigh (D) and of neoplastic origin (H). CD7-negative cells were further subdivided into FSC/SSClow (left of the broken line in C), and FSC/SSChigh (right of the broken line in C). The CD7-negative, but FSC/SSChigh, cells were neoplastic (G), while the CD7-negative FSC/SSClow cells were essentially normal (F). CD34+ cells was the positive control (E). II. Molecular analysis of stem cell subpopulations in four patients. Sorting and analysis was done as in figure 2.I A for 3 additional patients. # FLT3-ITD (% of total signal: FLT3-ITD + wt) determined in cell populations sorted from CD34+ AML patients. * shown in figure 2.I A. § FSC/SSClow and FSC/SSChigh defined as outlined in Table 2.
Figure 3
Figure 3. Marker negative pLSCs co-exist with marker positive pLSCs and are identified by scatter and CD34/CD45 expression patterns.
CD34+ CD38- cells (patient 372) were identified as described in figure 1.I and gated for sub-compartments as described for figure 2.I. In the stem cell compartment of this AML case, only 11% could be identified as CD19+ (A). When back-gated in FSC/SSC (similar as performed in Figures 1 and 2), two different populations were identified based on the position in FSC/SSC: the small CD19+ fraction (events in red in A–D) is characterized by FSC/SSChigh (B), low CD34 expression (C) and high CD45 expression (D). CD19 negative cells (events in green in A–D), apart from a small FSC/SSClow/CD34high/CD45low population of putative HSCs (A–D), contained a large population of cells that, similar to the CD19+ population in A–D, were FSC/SSChigh (B), CD34low (C), and CD45high (D). Apart from CD19, CD7 was an aberrant marker: 61% of the cells was CD7+ (E). Upon backgating, CD7+ cells (events in red in E–H), similar to CD19+ cells, were all FSC/SSChigh (F) CD34low (G) and CD45high (H). In contrast to CD19, CD7 negative cells (events in green in E–H) now completely consisted of a small FSC/SSClow (F), CD34high(G), CD45low (H) fraction. CD7 thus covered the whole neoplastic CD34+CD38- population and shows perfect discrimination between HSC and pLSC. CD19 expression in the absence of both CD7 expression and other scatter and CD34/CD45 expression parameters would have under-estimated the pLSC in the CD34+CD38- compartment by a factor 5.5 (61%/11%), while the HSCs would have been over-estimated by a factor 2.3 (89%/39%). In this case CD7 was a good marker to compare with the poor CD19 marker; it can be seen, however, that in the absence of CD7 expression, but with the scatter and CD34/CD45 aberrancies present, these would have enabled a complete discrimination between putative HSC and LSC compartments. This patient was identified as NPM1-positieve and FLT3-ITD positive. Other molecular aberrancies were not detected.
Figure 4
Figure 4. Multilineage engraftment of CD34/CD38 and scatter-defined putative HSCs.
Unsorted mononuclear cells (MNCs) were injected intravenously and resulted in leukemic engraftment: cells were CD45+ (A) and of myeloid origin (B). In this case, the myeloid cells were positive for the diagnosis of leukemia-associated phenotype (LAP): partly CD33+CD13- (C) and CD11b+ (D). Sorted putative HSCs were injected intrafemorally (details, see Table S5). Engrafted CD45+ cells (E), contained both B-cells and myeloid cells (F), and lacked LAP (G,H). Multilineage engraftment of the sorted subpopulations was seen for patient 598 (I), 661 (J), 423 (K), and 928 (L). B-cells and myeloid cells (percentage of CD45+ cells) are in the upper left and lower right corners of the plots, respectively. The AML cells of patients 598 (I) and 661 (J) had an aberrant phenotype at diagnosis that was present in the neoplastic engrafted cells, but absent in the normal cells (not shown).
Figure 5
Figure 5. Prognostic value of frequencies of pLSC compartments at diagnosis.
This figure shows the Kaplan-Meier analyses at diagnosis for the three compartments putatively containing pLSCs: CD34+CD38- (A,B,C), CD34+CD38+ (D) and CD34- (E). Of the 117 patients shown in Table S3, for Figures 5 and 6, 88 patients were chosen who had at least one follow-up time point. Of these, 70 entered Complete Remission, of whom 53 after the first course, 13 after the second course and 4 at later stages. Eighteen never reached CR. The size (median values) of the CD34+CD38- compartment at diagnosis was significantly (six-fold) higher in patients who did not enter CR (n = 18) compared with patients who did (n = 70): 0.225% of WBC versus 0.036% of WBC (p = 0.041). For CD34+CD38+ and CD34-, there were no significant differences (see text). Cut-off levels were defined to divide the total population into high stem cell frequencies (above cut-off) and low stem cell frequencies (below cut-off). A particular cut-off value was chosen (A, D, E) to ensure approximately equally numbers of patients in the resulting high and low stem cell frequency compartments. Results for other cut-offs for the three pLSC compartments are in Table S6. A–C: CD34+CD38-; D: CD34+CD38+; E: CD34-. A. RFS in remission patients (n = 70) with diagnosis CD34+CD38- cut-off of 0.03%; B. RFS in the same patient group (n = 70), but now with 2 cut-offs (0.005% and 0.1%); C. Event-free survival for all CR and non-CR patients (n = 88); D. RFS in remission patients (n = 70) with CD34+CD38+ cut-off of 25%; E. RFS in remission patients (n = 70) with CD34- cut-off of 3%. All relevant prognostic variables with statistical significance were investigated in a multivariate model. In this multivariate analysis it was found that risk group (according to the HOVON 102 trial) was an independent prognostic factor for OS at diagnosis (p = 0.001). For RFS, both risk group and CD34+CD38- leukemic stem cell load (using a 0.03% cut-off point) were independent prognostic factors at diagnosis (p = 0.017 and p = 0.011, respectively).
Figure 6
Figure 6. Prognostic value of frequencies of CD34+CD38- pLSC compartment at follow-up.
This figure shows the Kaplan-Meier analyses for RFS for the CD34+CD38- pLSC compartment at follow up for three consecutive therapy cycles. The optimal cut-off levels were chosen to define pLSC + and pLSC- after 1st induction cycle (0.0003%,which is 3 pLSCs in 1,000,000 WBC) and after 2nd induction cycle and consolidation therapy 0.0001% (1 pLSC in 1,000,000 WBC). Results for other cut-offs are in Table S7. After the first induction cycle (B, 71 patients), second induction cycle (C, 77 patients), and after consolidation therapy (D, 48 patients), patients with high pLSC frequency (pLSC+) showed significantly more adverse performance compared with patients with low pLSC frequency (LSC-).
Figure 7
Figure 7. Prognostic value of combined p-LSC and MRD.
(A) Kaplan-Meier analyses after cycle II for RFS for the pLSC data as shown in Figure 6, with an additional 23 patients (Table S1). The pLSC cut-off used is 0.0001%. (B) Kaplan Meier analysis of MRD data (cut-off 0.1%) obtained for the same patient group as in A (n = 91). (C) Combined pLSC and MRD (n = 91) data resulted in 4 patient groups: pLSC-/MRD-, pLSC-/MRD+, pLSC+/MRD- and pLSC+/MRD+.

References

    1. Valent P, Bonnet D, De MR, Lapidot T, Copland M, et al. (2012) Cancer stem cell definitions and terminology: the devil is in the details. Nat Rev Cancer 12: 767–775. - PubMed
    1. Lapidot T, Sirard C, Vormoor J, Murdoch B, Hoang T, et al. (1994) A cell initiating human acute myeloid leukaemia after transplantation into SCID mice. Nature 367: 645–648. - PubMed
    1. Bonnet D, Dick JE (1997) Human acute myeloid leukemia is organized as a hierarchy that originates from a primitive hematopoietic cell. Nature medicine 3: 730–737. - PubMed
    1. Dick JE (2008) Stem cell concepts renew cancer research. Blood 112: 4793–4807. - PubMed
    1. Taussig DC, Vargaftig J, Miraki-Moud F, Griessinger E, Sharrock K, et al. (2010) Leukemia-initiating cells from some acute myeloid leukemia patients with mutated nucleophosmin reside in the CD34(-) fraction. Blood 115: 1976–1984. - PMC - PubMed

Publication types

MeSH terms